3.1.1. Single reagent assay
Initially SIA systems were assembled similarly to FIA instrumentation from individual components and operated in milliliter scale. Following introduction of LOV concept SIA was downscaled to microliter range. Since this Chapter is focused on performance SIA-LOV method and limited to automation of reagent-based assays, it is recommended reading a comprehensive review (Mesquita & Rangel 2009) , where performance of FIA, SIA and SIA-LOV are critically evaluated and used for determination of numerous analytes in waters, because it will provide a valuable insight into full range of capabilities and applications of SIA technique.
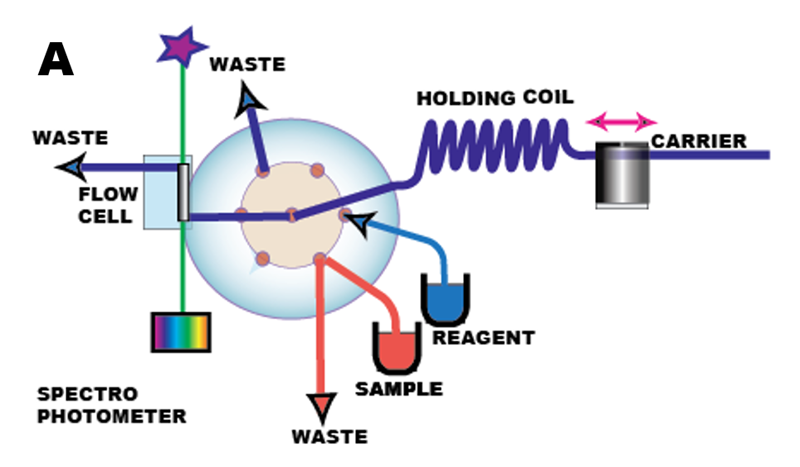
Design of Sequential Injection instrument (A) is based on two concepts: blending the sequence of sample and reagent zones by flow reversal, and integration of miniaturized manifold components within lab-on-valve platform (B). The present version of SIA instrument took many years to develop: starting with initial SIA concept (Ruzicka & Marshall 1990) followed ten years later by integration with lab-on-valve platform (Ruzicka 2000) construction of instrument was gradually facilitated by the availability of essential components: fiber optic flowcells, high precision milliGAT pumps, and suitable software.
B
The protocol for single reagent assay (C) comprises five steps: Sample (1 red) and reagent (2 blue) are injected sequentially, by means of a multiposition valve (MPV), into a carrier stream of deionized water, and transported upstream into holding coil, while the reaction product (3 yellow) starts to form at the interface of adjacent zones. Next, a flow reversal (4) is applied, to further promote mixing and to transport the reaction mixture into the detector for monitoring (5).
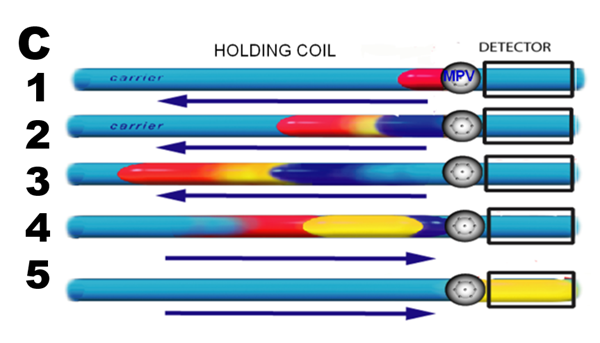
Since the movement of sequentially injected zones is computer controlled, the time interval between sample injection (1) and analyte detection (5) is reproducible. In this way, all samples are processed in exactly the same way, allowing comparison of standards with unknowns, by means of the calibration line.
There are two ways in which concentration of reaction product – on which calibration is based, can be monitored:
- While reaction mixture is moving through flow cell
- While reaction mixture is arrested within the flow cell
The first approach Stop in Holding Coil (SHC) method is based on applying a stop flow interval between steps 3&4 to provide an incubation period for the reaction product to form.
The second approach Stop in Flow Cell (SFC) method is based on applying stop flow interval while the centroid of sample/reagent zone is within the middle of the optical path of a flow cell.
Let us compare SHC with SLC protocols by performing spectrophotometric determination of glucose by using commercially available chromogenic reagent comprising glucose oxidase, peroxidase, color reagent, and buffer combined (Pointe Scientific), and DI water as a carrier. The red colored reaction product was monitored at 500 nm in both experiments.
The movie clip (D) in SHC mode shows the reaction mixture entering the holding coil (from top) followed by 30 seconds stop flow incubation time during which red color is gradually formed until the mixture is flushed out on the way into flow cell.
D
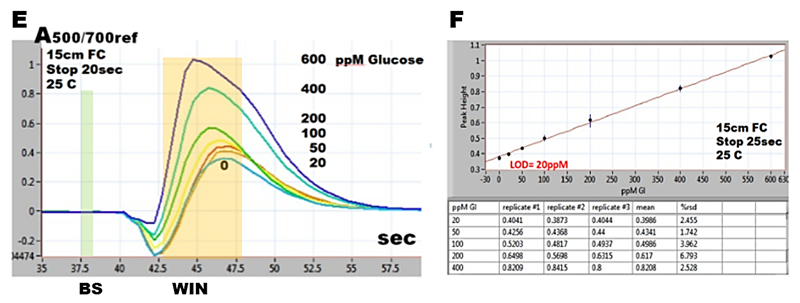
Therefore, response of SHC method has form of a peak (E), the maximum of which, captured within WIN related to zero at baseline BS yields a linear response within 0 to 600 ppm glucose concentration (F).
The movie clip (G) in SFC mode shows the reaction mixture entering the flow cell, stopping the flow for 20 seconds during which red color within the flow cell intensifies followed by rapid washout.
G
Therefore, response of SFC method is reaction rate curve (H), the slope of which, or end point captured within WIN related to zero at baseline BS yields a linear response within 0 to 600 ppm glucose concentration (I).

There are two ways in which SFC response can be maximized
- By increasing incubation time within the flow cell
- By positioning center of sample/reagent zone in optical path of a flow cell
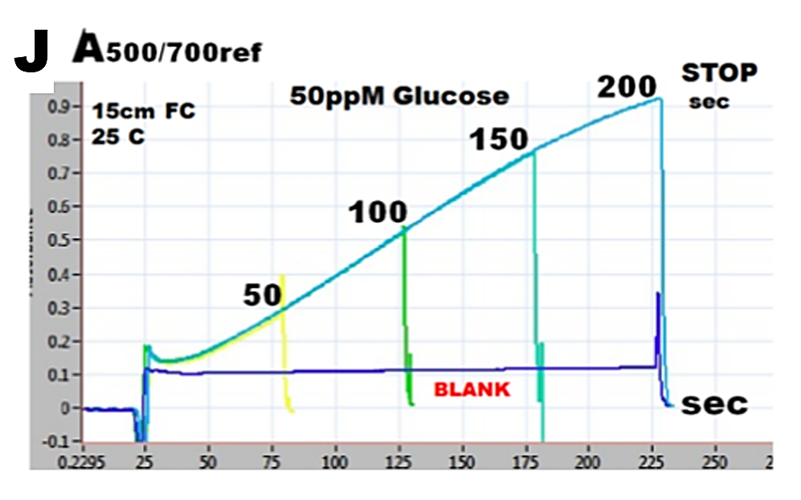
Series of reaction rate curves, obtained at increasing stopped flow times, while using with 50ppM glucose standard solution are shown superimposed (J). Reaction yield increases linearly with increasing incubation time, while the blank value, although high, remains constant.
 Positioning the most concentrated section of dispersed sample zone in the flow cell is accomplished by selecting the volume of carrier solution used to transfer sample zone from the holding coil. Therefore, this transfer volume must be identified by performing series of stop flow experiments whereby increasing volumes of carrier are applied to transfer sample/reagent mixture into flow cell, before stopping the flow (K).
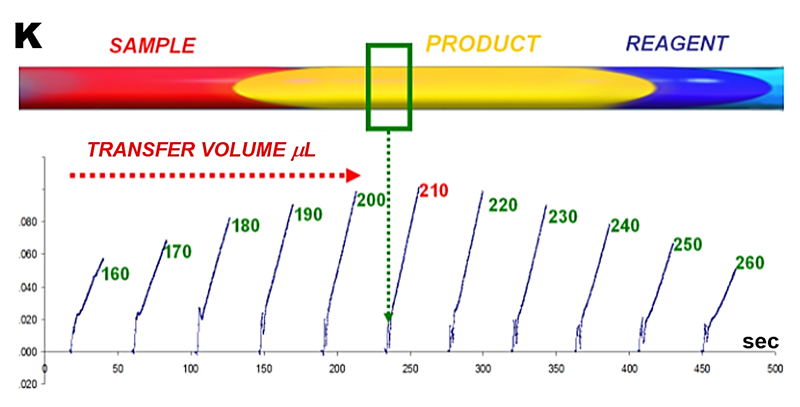 The calibration run (H) and calibration graph (I) were obtained with stop flow period of 100 seconds and transfer volume of 210 µl.
Raquel B.R. Mesquita, Antonio O.S.S. Rangel “A review on sequential injection methods for water analysis” Analytica Chimica Acta 648 (2009) 7–22
J. Ruzicka & G.D. Marshall, “Sequential Injection: A New Concept for Chemical Sensors, Process Analysis and Laboratory Assays“ Anal. Chim. Acta, 237, 329, (1990)
J. Ruzicka, "Lab-on-valve: universal microflow analyzer based on sequential and bead injection" Analyst, 2000,125, 1053-1060