3.2.3. Stop in Flow Cell protocol
To obtain reproducible data a sample zone must be arrested within the flow cell in exactly the same position for each sampling cycle. The position is determined by three variables: volume of sample reagent mixture (S+Rv) of flow cell volume (FCv) and of transfer volume (TRv) which is the volume used to transfer S+R mixture from holding coil into the within the flow cell.
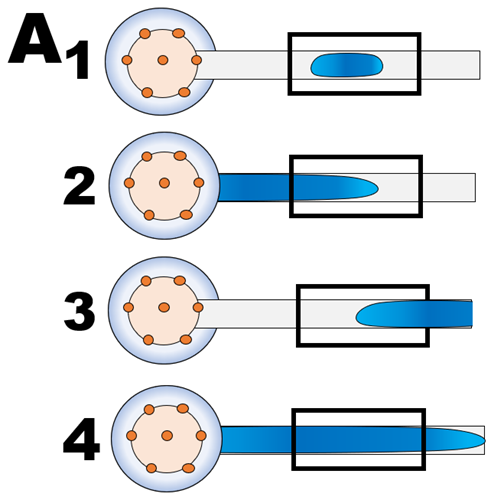
There are four ways in which the mixture can be placed within the flow cell (A).
- Entire zone is smaller then FCv. Sensitivity of measurement will be lower, because flow cell is not filed up and response will be blend of reaction rate and rate of diffusion as the zone expands due to difference between ionic strength of the zone (high) and DI water carrier (low).
- The leading edge of a large Sv, trapped within flow cell serves as a focusing lens, formed at interface between low and high ionic strength solutions (Schlieren effect). Therefore intensity of light transmitted through flow cell will increase (causing A value to become negative) and will change as the lens reforms due to diffusion
- The defocusing lens formed at trailing edge will increase absorbance due to decrease of intensity of light reaching the detector
- Filling entire flow cell with central section of S+R zone is the optimized position for reproducible SFC based measurement.
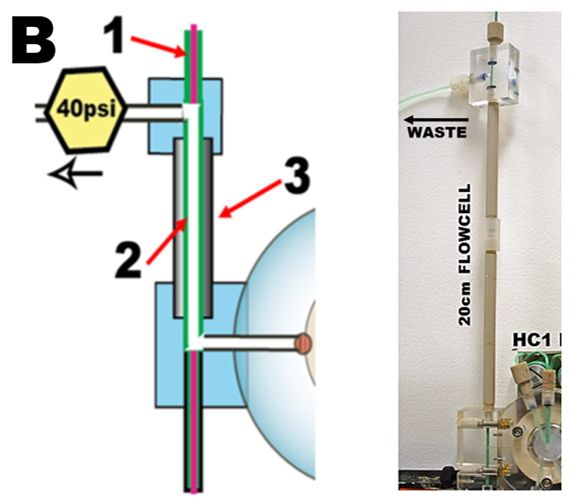
 The linear light path (LLP) flow cell (Hatta 2020) mounted on LOV module (B) is connected to spectrophotometer and light source by optical fibers (1). Its optical path, is made of 0.8 mm I.D, green PEEK tubing (2) sandwiched between optical fibers (1) and held straight by tubular support (3), LLP flow cell was “homemade” from easily available components (Ch. 6) with optical path up to 50 cm long. Unless stated otherwise, all experiment in Chapter 3 were performed with LLP 20cm long volume 100 µL. (Note: the 40 psi flow restrictor prevents formation of air bubbles formed by degassing of air dissolved in samples, reagents, and DI water. By keeping slightly elevated pressure within LOV and LLP the need for degassing reagents and DI is eliminated).
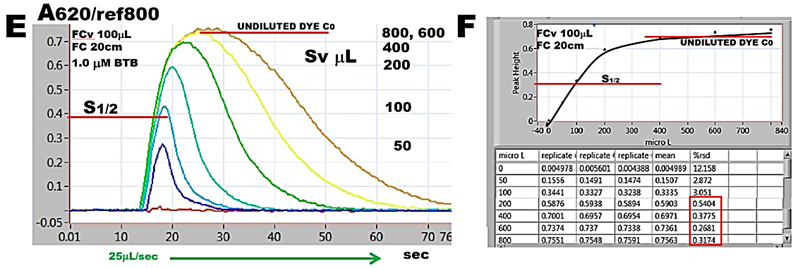
 To identify R+Sv and R for flow channel equipped with 20cm LLP a flow scheme representing step 3 of assay protocol (C) and corresponding software protocol (D) were set up. Decreasing volumes of BTB dye in the range of 800 to 0 µL were aspirated into HC1 (800,160,1; 600,120,1; 400,80,1; e.t.c) and resulting absorbance/time responses were plotted superimposed (E) while corresponding max A values were plotted versus volumes of injected dye (F). Since flow cell becomes filled with undiluted dye at Sv> 500 mcrL, all SFC protocols in this Chapter were adjusted, out of caution, to set volume of reaction mixture to 600 µL and transfer volume (TRv) 300 µL. Note that when the flow cell monitors the undiluted dye, the r.s.d. is better than 1%.

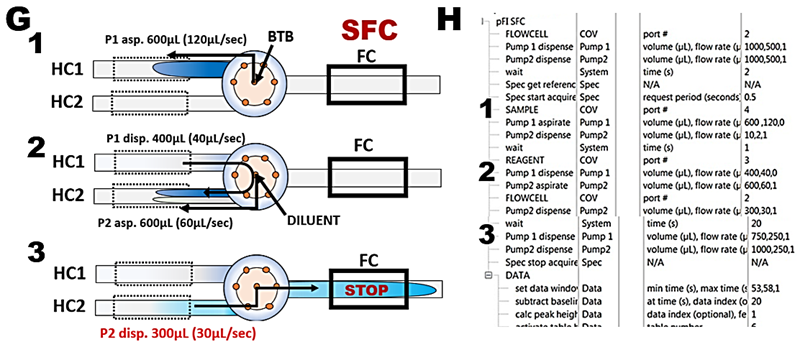
 The adjusted SFC flow scheme (G) and protocol (H) to be later used for determination of nitrite is tested by calibration experiment with BTB (I and J).
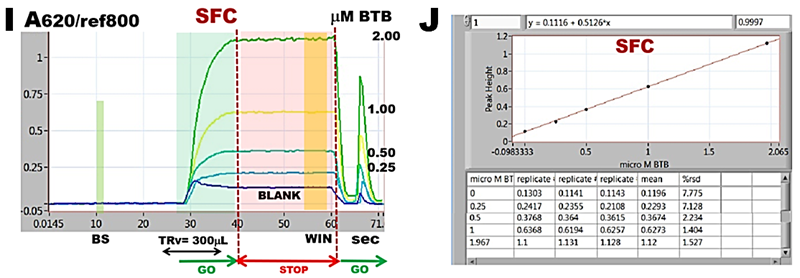 These experiments confirm that flow programming and instrument performance yield linear and reproducible response to concentration of BTB and will therefore automate in reliable way reagent assays with spectrophotometric detection in SFC mode. An increase of r.s.d. value to 2% (J) compared to 0.8% when flow cell was filled with undiluted dye (F) is caused by more complex microfluidic manipulations that control dilution of sample by reagent stream at confluence point. Constant values of absorbance recorded during stop flow interval recoded when the dye is trapped in the flow cell (I) confirm that changes of absorbance that will be recorded during reagent based measurements will be caused by ongoing chemical reactions.
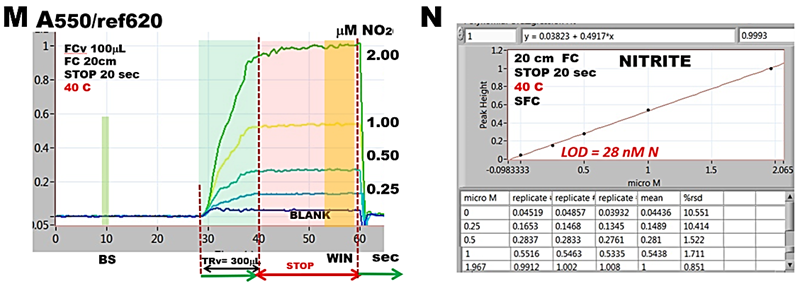
Determination of nitrite, based on the Griess reaction, automated above in SHC format is here used to demonstrate reaction rate measurements in SFC mode. This chromogenic reaction produces an azo dye, which is pink in its protonated form (ε = 4.6E04 at 550 nm) and, being endothermic its reaction rate increases with temperature. At room temperature (K) reaction does not reach equilibrium with the exception of lowest nitrite concentration. Yet the calibration response is strictly linear (R = 0.9994) and therefore this protocol is suitable for performing nitrite determination.
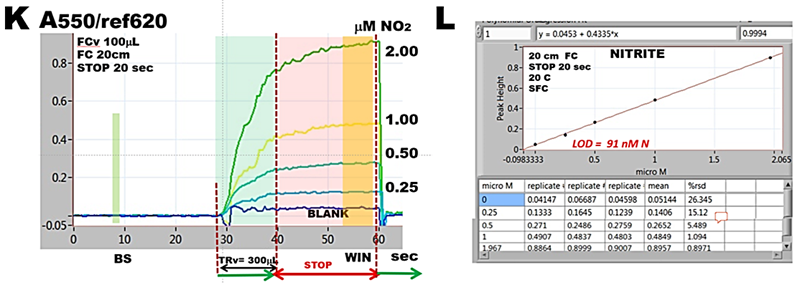 At elevated temperature (M), when holding coils are thermostated at 40 C reaction rates reach equilibria at all concentrations and therefore the calibration line (N) has higher slope, the determination is more sensitive and LOD is improved.
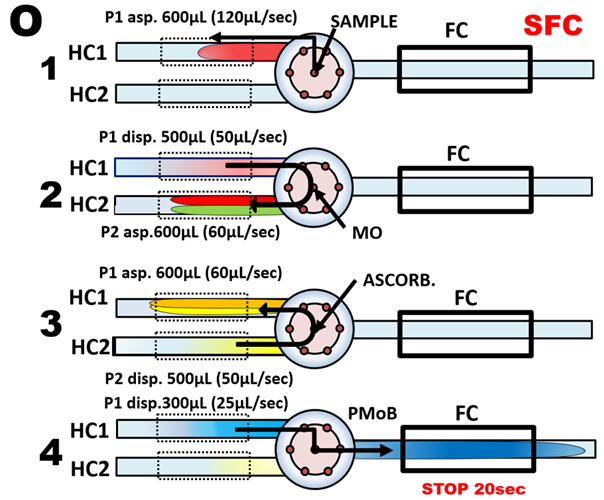
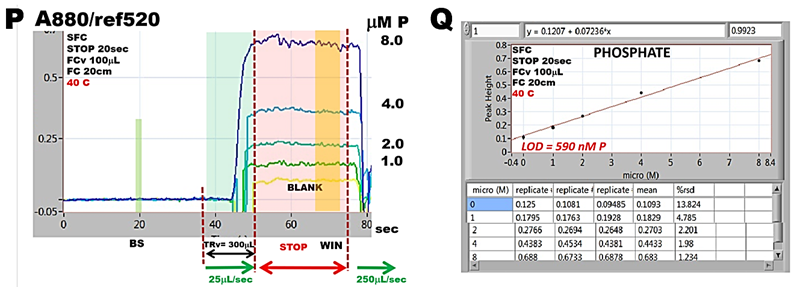
 Determination of phosphate is example of two reagent based determination in SFC format. It is based on spectrophotometry of phosphomolybdenum blue (PMoB), measured at 880 nm, (ε = 3.3E04) PMoB is produced in two steps; first yellow phosphomolybdate (PMo) is rapidly formed, followed by gradual formation of the PMoB compound upon addition of ascorbic acid. Both reactions are performed in a strongly acid solution (pH 0-1) to prevent interference from molybdenm blue (MoB) as well as from silica molybdenum blue (SiMoB), which is formed in the presence of silicic acid.
The four steps flow protocol (O) automates the manual method whereby a metered sample volume (1), is mixed with acidified molybdate (2), followed by ascorbic acid (3) forming 600 µL reaction mixture, which is transferred into flow cell (TRv = 300 µL) for 20 sec long stop fellow monitoring period (4). By thermostating holding coils at 40 C reactions reach equilibria (P) at all concentrations. (Note that noise level increases with increasing A value. This is due to low light intensity of Tungsten light source at 880 nm).
 The resulting calibration obtained by collecting highest A value within data collection window (WIN) while zero A is set at BS when flow cell is filler with DI water, is linear. The reason for high LOD value is explained in discussion about Limit of Detection later in this Chapter.
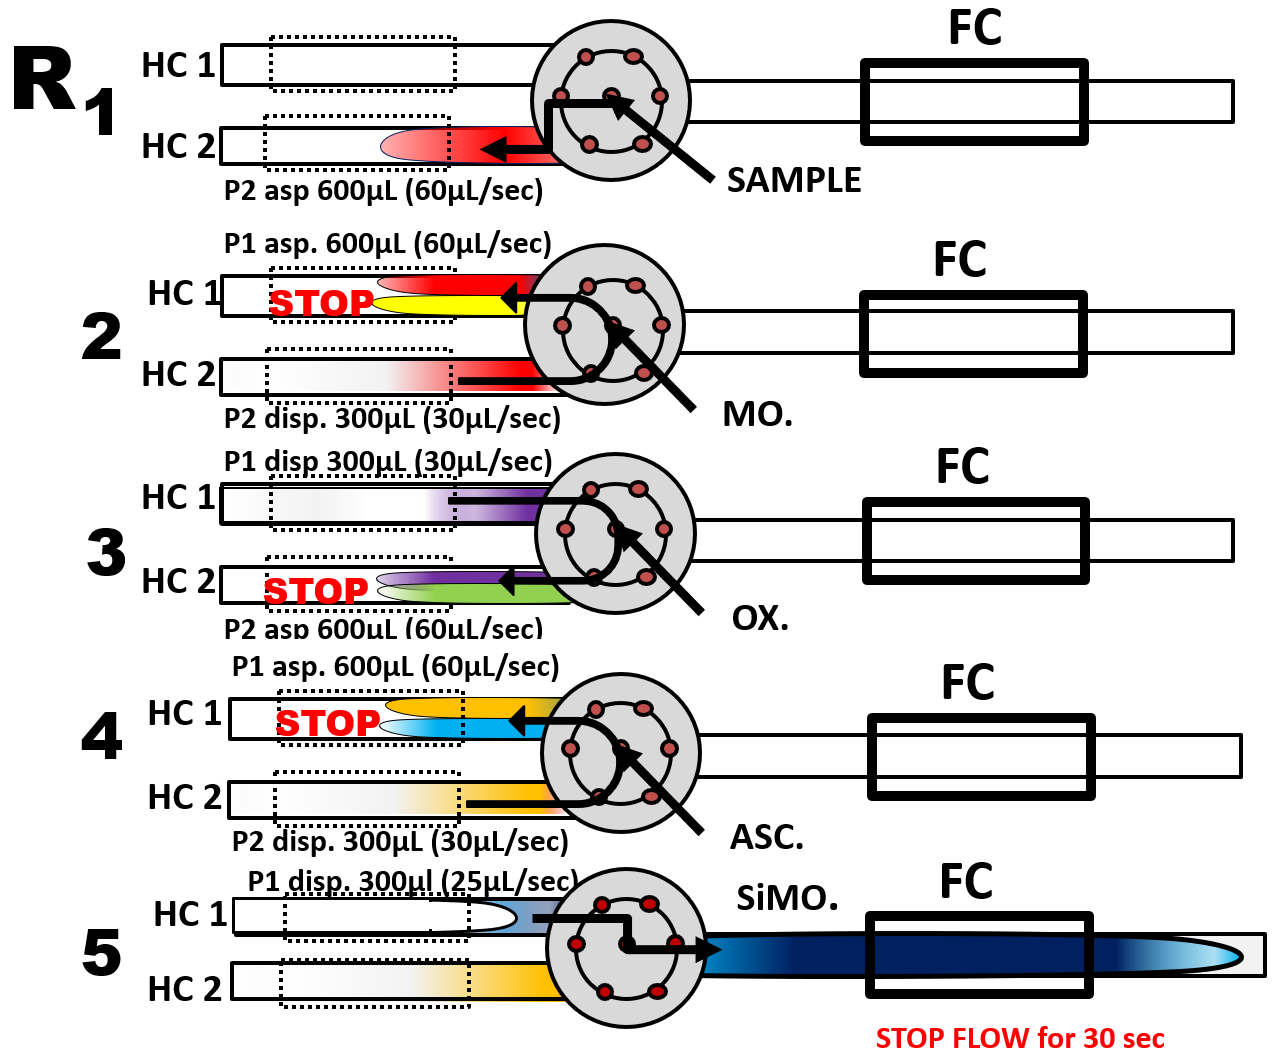
 Determination of silicate is example of three reagents based determination in mixed SHC and SFC format performed at 50 C by thermostating the holding coils. Automated, as shown in flow scheme (R) the silicomolybdate (SiMo) is formed first (step 2) in a mildly acid medium, where, if phosphate is present, phosphomolybdate (PMo) is also formed. To avoid phosphate interference oxalate is added next (step 3) to decompose PMo. Ascorbic acid is used to reduce SiMo to SiMoB (step 4). Finally, the reaction mixture was transported into the flow cell where the absorbance was monitored for a 30 second stop flow period. Additional 10 seconds stop flow periods in steps 2, 3, and 4 were implemented to drive reactions to completion for reasons explained in next section.
 The absorbance/time graph (S), obtained by analyzing silicate standards (0 to 27 µM) comprises two sections: the flow part (shaded in green), and the following stop-flow period lasting 30 seconds (shaded red). Changes of absorbance, monitored at 810 nm, within the time interval shaded in green, are recorded while sample/reagent mixture moves into the flow cell, while during interval shaded in red reaction mixture is held within flow cell and A value is recorded within the WIN period. Since a sample containing 4 µM P did not elevated BLANK value concentrations of phosphate up to this level will not interfere in determination of Si.
The resulting calibration (T) is linear with r.s.d. better than 2% while LOD= 240 nM Si.
 In summary SFC method is more difficult to optimize than SHS method, but since measurement of absorbance takes place in static conditions when the reaction mixture is held still, it yields slightly more reproducible results than SHS method when absorbance measurement is performed on moving stream.
Mariko Hatta, Jaromir (Jarda) Ruzicka, Christopher I. Measures “The performance of a new linear light path flow cell is compared with a liquid core waveguide and the linear cell is used for spectrophotometric determination of nitrite in sea water at nanomolar concentrations “ Talanta 219 (2020) 121240