3.2.4.3. Batch Method as a Research tool
Continuous Flow Injection was used in the past to investigate enzyme inhibition, protein immobilization and response of live cells to stimulants. Flow programming expands the range into topics that can only be investigated when concentration of reactants is known and reactions reached equilibria, such as in the following examples:
Molar absorptivity (molar extinction coefficient), ε is absorptivity (A) of one molar solution (C) measured in 1 cm long light path (L) at a given wavelength. Since:
A = ε × L × C
Molar absorptivity can be calculated from the slope of calibration line (A/C) adjusted by length of light path and by dilution of initial concentration of target analyte by reagents. Molar absorptivities of chromogenic reagents are in the range of 1.5x10E04 to 8×10E04 , the. value increasing with size of target molecule (Cheng 1982). Obviously knowledge of ε value allows estimate of sensitivity of the method and Limit of Detection (LOD) of and thus serves as a benchmark for optimization of assay protocols.
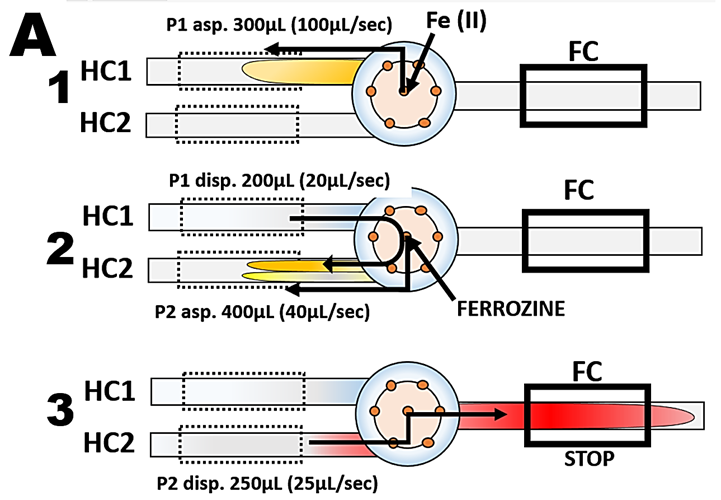
Ferrozine®, sodium salt of pyridyldiphenyltriazine sulfonic acid (m.w. 492.46) is related to the group of ferroin reagents, that all form water soluble chelates with iron (II). Red ferrozine-Fe (II) chelate adsorbs at 562 nm, being formed in acetate buffer at pH=4.5 in presence of hydroxylamine that serves as reducing agent, The flow programming (A), for this determination comprises three steps. The reduction to Fe(II) and complexation by ferrozine takes place in the second step in HC2, after sample was mixed with reagents at confluence point. In the third step reaction mixture is transferred to flow cell for absorbance monitoring for 20 sec long stop flow period. A values, recorded when series of Fe(II) standards in the range of 0 to 200ppB Fe, prepared by manual serial dilution, were analyzed, were recorded and are shown superimposed (B).


Because reaction of Fe(II) with ferrozine is very fast, equilibrium was reached already on the way to flowcells and therefore A values during stop flow period do not change. Therefore the absorbance values collected before the flow was resumed (WIN) represent a complete formation of Fe(II)ferrozine complex. The slope of the resulting calibration line (C) is
5.05 mAU / 1ppB Fe(II)
Measured in 20cm long light path, on a solution of Fe(II), diluted in ratio 1 + 1. This yields the molar absorptivity (Fe a.w.= 55.9) at 620nm:
ε = 2.83E04
while the value listed in the literature (Cheng 1982) is:
ε = 2.86E04
Also molar absorptivity of bromothymol blue, determined by batch FI method is in close agreement with value listed in literature.
Dissociation constant pK of acid-based indicator equals to pH at which concentrations of its acid and basic form are equal. Therefore pK value define a range within which an indicator can be used for measurement of pH. While glass electrode is prevalently used for majority of pH measurements, its reproducibility is +/- 0.05 pH at best controlled conditions, is not sufficient for oceanography where a desired precision is +/- 0.001 pH, Therefore attention of oceanographers has turned towards spectrophotometric pH determinations, recently also automated in continuous Flow Injection Format (Ma 2019, section 2.5.2.1. to 2.5.2.3.)
Since determination of pH is best performed at equilibrium conditions and in sea water also at static conditions (to avoid Schlieren Effect) the following example of pFI-LOV spectrophotometry used for determination of pK of bromothymol blue can serve as a template for development of flow protocol for determination of pH in sea water. Bromothymol blue is yellow in protonated and blue in deprotonated form with transition point between pH 7 and 8. It has a well defined spectrum with maxima at 450nm and 620nm, their absorptivity being dependent on pH. This acid/base equilibrium is described by Henderson-Hasselbach equation:
pH = pKa + log[A-]/[HA]
where pKa is dissociation constant and [A-] and [HA] are deprotonated and protonated concentrations of BTB. The simplest approach to determination of pKa of BTB is to measure changes of absorbance with pH at 620nm, because at this wavelength the absorbance is linearly dependent on [A-] and is only due to concentration of the deprotonated form [A-]. Flow programming (D) is designed to aspirate buffer in step 1 and unbuffered blue form of 2000 ppb BTB solution in step 2. DI water is used as carrier.
Absorbance/time responses are shown in (E).


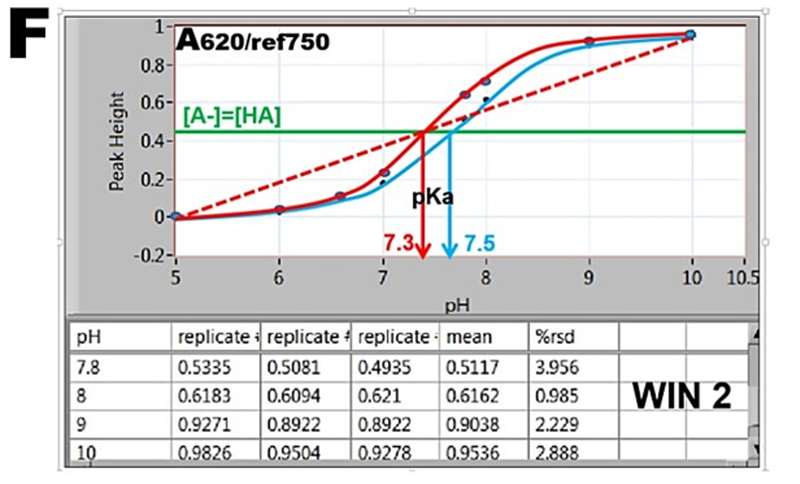
By plotting absorbance versus pH values the S-shaped “indicator” curves are obtained (F), revealing pH=pK values located at inflection point where [A-]=[HA]. The absorbance values A, collected in WIN 2 result in the blue curve, while data obtained in WIN 1 are shown as red curve. Furthermore, since absorbance A at 620nm is a linear function of [A-], the red dotted line connecting fully deprotonated (pH=10) and protonated BTB (pH=5) intersects at A/2 at pH=pKa. The red S-curve and the linear extrapolation intersect at the same pH yielding pKa= 7.3. The listed value of BTB dissociation constant (Bishop 1978) is pKa=7.3. The blue S curve yields pKa=7.5. The reason for decrease of absorbance during stop flow period is presently unknown.
Investigation of phosphomolybdenum blue method
Discovered almost 200 years ago, the phosphomolybdenum blue (PMoB) method is one of the most frequently used reagent-based techniques. Therefore it has undergone countless optimizations and modifications, reported in over 2500 publications. Yet findings of these works are incomplete and sometimes contradictory. The recently published, outstanding comprehensive review of PMoB method and its underlying chemistry, entitled "The molybdenum blue reaction for the determination of orthophosphate revisited: Opening the black box" (Nagul 2015), summarizes all what we know about this method. This review also inspired further questions, about what we do not know, such as:
- Why reported molar absorptivity (ε) obtained with the same procedure (Murphy-Riley) varies from 21.600 AU to 25.670 AU while the highest reported (ε) value at nearby wavelength is 32.000 AU (Nagul 2015 Table 3)
- While 880nm is most frequently used wavelength, why almost any wavelength within 500nm to 900nm range was used as well?
- While it is generally accepted the PMoB assay is best performed in acid solutions pH 0 to 1, and that concentration of molybdate and ACIDITY of reagent are mutually dependent, what are the reasons for this method to fail outside this range?
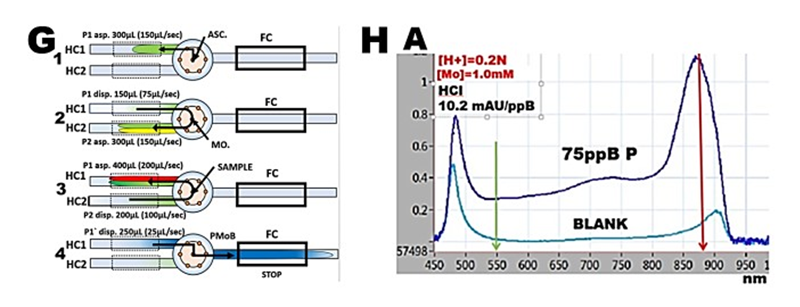
pFI-LOV method programmed in batch mode was used to optimize composition of molybdate reagent for determination of phosphate, by identifying conditions at which the slope of calibration line was maximized. By using flow protocol (G) phosphate standards, prepared by manual serial dilution, in the range 0 to 75 ppB P were analyzed to obtain spectrum (H) and a calibration line, the slope of which was used to compute molar absorptivity.
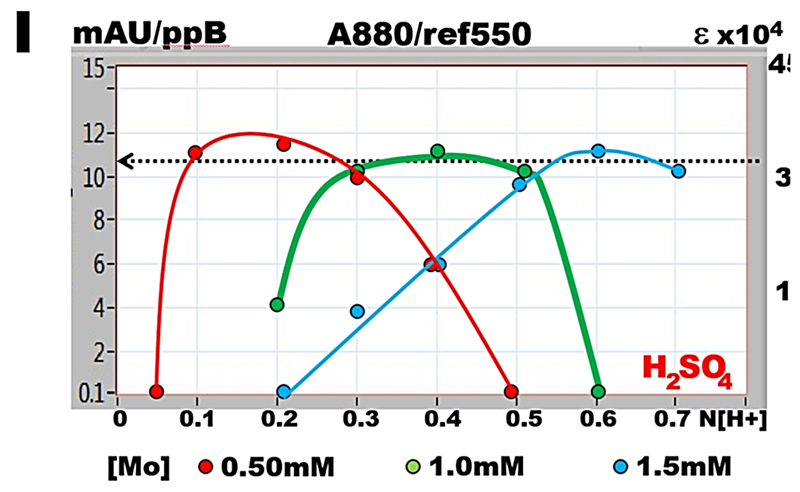
 The [H+] diagrams, obtained by plotting acidity, against slope of calibration line, reveal that the maximum slope is reached at a suitable combination of [H+] normality with concentration of molybdate [Mo]. Strikingly, yet not surprisingly, maximized slope of calibration line is the same over the entire range of [H+] and [Mo] concentrations presented in [H+] diagrams, and is independent of the type of acid used in this study.
The value of the maximized slope, averaged to 10.5 mAU/ppB P, was measured using 20 cm long optical path, in solutions of phosphate standards diluted with reagents in ratio 1 + 1. This yields for a.w. P=31 the molar absorptivity ε = 3.3E04 measured at 880nm with reference at 550nm.
The spectrum of reactants (A) at optimized conditions exhibits single, well defined maximum, with a shoulder showing an elevation at 720nm. Spectrum in absence of phosphate (BLANK), is flat between 550 and 800nm.

Each point on the [H+] diagram (I) represents the slope of calibration line plotted versus acidity of molybdate reagent. It reveals that the maximum slope is reached at a suitable combinations of [H+] normality with concentration of molybdate [Mo]. Strikingly, yet not surprisingly, maximized slope of calibration line is the same over the entire range of [H+] and [Mo] concentrations presented in [H+] diagrams, and is independent of the type of acid used.
The value of the maximized slope, averaged to 10.5 mAU/ppB P, was measured using 20 cm long optical path, in solutions of phosphate standards diluted with reagents in ratio 1 + 1. This yields for a.w. P = 31 the molar absorptivity ε = 3.3E04 measured at 880nm with reference at 550nm.
The spectrum of reactants (H) at optimized conditions exhibits single, well defined maximum, with a shoulder showing an elevation at 720nm. Spectrum in absence of phosphate (BLANK), is flat within 550nm to 850nm. Therefore to optimize assay conditions the composition of molybdate reagent in the flow cell should be within the flat section of [H+] diagram. (Ruzicka 2019). At higher acidities formation of PMoB is suppressed, while at lower acidities spectrum of PMoB (H) is obscured by formation of colloidal MoB.
L.Cheng, K. Ueno and T. Imamura: “Handbook of Organic Analytical Reagents” CRC Press. NY. 1982 p. 326.
Jian Ma et.al. “Spectrophotometric determination of pH and carbonate ion concentrations in sea water, Choices, constraints and consequences” Anal. Chim. Acta. 1081, (2019) 18-31.
E. Bishop ‘Indicators” Pergamon Press Oxford 1978. Also CRC Handbook of Chemistry and Physics; Lide, D. R., Ed.; CRC Press:: Boca Raton, FL, 2007-2008
E. A. Nagul, I.D. McKelvie, P. Worsfold, S. D. Kolev. “The molybdenum blue reaction for the determination of orthophosphate revisited: Opening the black box” Anal.Chim.Acta. 890, (2015), 60.
Ruzicka, J.; Marshall, G. D.; Measures, C. I.; Hatta, M., Flow injection programmed to function in batch mode is used to determine molar absorptivity and to investigate the phosphomolybdenum blue method. Talanta 2019, 201, 519-526.