3.2.5.4. Elimination of Matrix Effect by Autocalibration
J. Ruzicka, M. Davis, Ch. Measures, M. Hatta, © May 2022
Since calibration of automated analyzers is usually based on standard solutions prepared by serial dilution in deionized (DI) water, determination of target analytes in other matrices requires correction of calibration data for Matrix Effect (ME) (Hatta 2023). E.g., spectrophotometric analysis of beverages ME is due to background color of soft drinks, beer or wine. Soil analysis is performed on extracting samples with concentrated electrolytes (Na acetate, Na carbonate), whereby ME is due to Schlieren Effect. Salinity of sea water (SW) may vary from 0% salinity up to 3.5% in open ocean, whereby ME is due to different reaction rates and optical densities of reagent/sea water mixture. If the calibration obtained with DI water-based standards fits linear regression:
y = a + bx /eq.1/
where a is the offset and b is the slope of calibration line, ME can be eliminated by adjusting eq.1 in the following way:
y = [ (a + oc) + bx ] * sr /eq.2/
where (oc) is offset correction and (sr) is the ratio of DI calibration line and Matrix (M) calibration line. We will obtain all these values by automated Single Standard Calibration (SSC) method.
Validation
To show how ME is eliminated by SSC method, we shall use spectrophotometric determination of nitrite in SW, based on the use of Griess reagent. The instrument (A) comprises two milliGAT pumps, two thermostated holding coils, LOV module furnished with a confluence point. The 20cm long optical path flow cell (B) is furnished with 40psi flow restrictor (FR) that prevents formation of air bubbles in flow channel and flow cell. Compositions of reagents and solutions are listed at the end of this section.
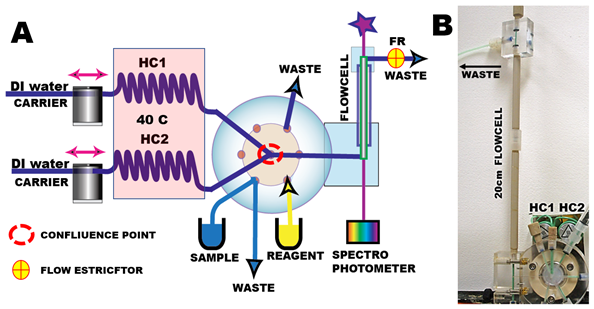 The flow protocol (C) for determination of nitrite by automated SS Calibration comprises three steps: 1/ sample dilution, 2/ chemical reactions, and 3/ monitoring of reaction products.
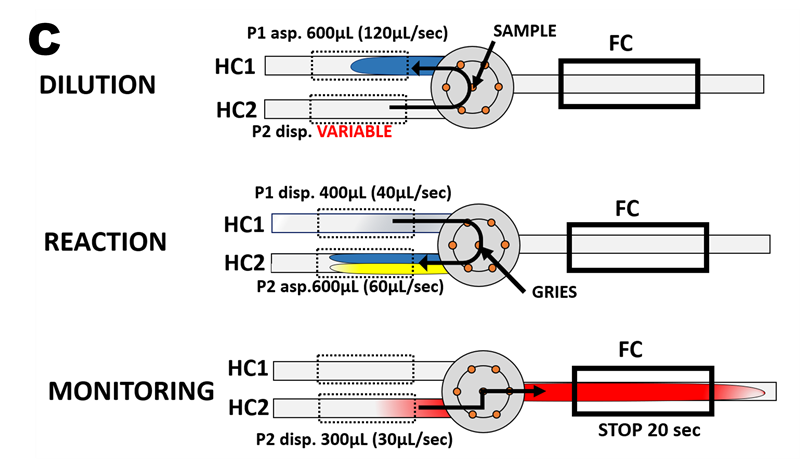
The DILUTION step is designed to perform stepwise dilution of Single Standard Solution by carrier solution – DI water - delivered by pump 2. The details of SSC protocol are in Section ( 3.2.5.2.), where Single Standard was diluted exponentially. Here we use linear dilution so that the dispensed volume of carrier by P2 increases from step 1 when Single Standard remains undiluted (100%) through steps 2 to 4 whereby SS is diluted to 75%, 50%, and 25%, while in step 5 the BLANK value is obtained by monitoring carrier stream. Thus, the calibration range will comprise five points in nano molar range when SS= 1000 nM N is used: 1000, 750, 500, 250, and 0 nM N.
The REACTION step is designed to mix metered volumes of sample and reagent solutions and to initiate chemical reactions forming colored compound to be monitored in the next step.
The MONITORING step is designed to transport reaction mixture into the flow cell in such a way that the centroid of the mixed zone is in the middle of the optical path, and thus the flow cell is entirely filled with a homogenous solution during the 20 second stop flow monitoring period.
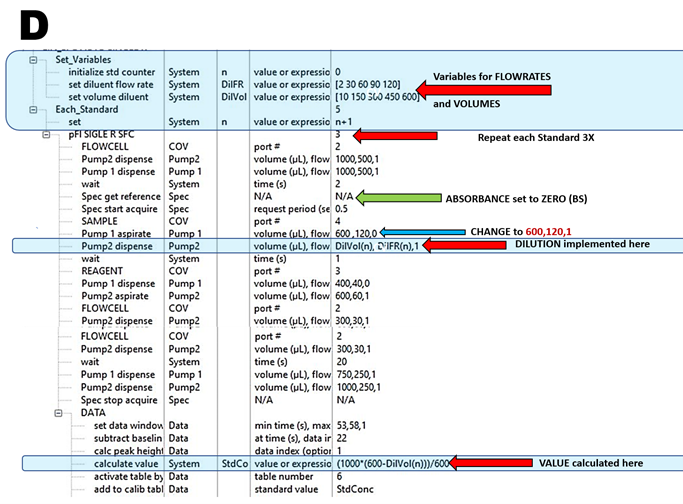
In this way, the flow programming reproduces conditions of manual batch type determination (3.2.4.2. and 3.2.4.3.), thus ensuring that Schlieren Effect is eliminated and monitoring is performed at or close to chemical equilibria – conditions that will minimize influence of ME. These conditions are fulfilled by using autocalibration SSC assay protocol (D) designed to generate five-point calibration in triplicate by linear dilution of the single standard.
To obtain DI calibration line and calibration slope ratio (cr) and salinity correction (sc), two sets of calibration are needed:
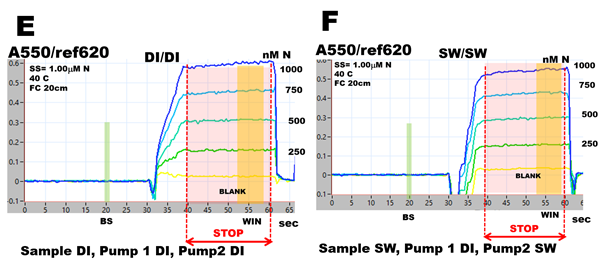
- DI/DI calibration with SS prepared in DI water and both carrier streams ( pump1 and pump 2) made of DI water (E and G)
- SW/SW calibration with SS prepared in SW, carrier stream pump1 of DI water, and carrier stream pump2 of SW. (F and H).
In this way, the DI/DI calibration is based on deionized water since the 1000 nM N SS was prepared in DI water and was diluted by DI, while SW calibration is based on SS prepared in SW and diluted by SW.
Calibration runs obtained in DI (E) and sea water (F) confirm that during data collection period (WIN), the Schlieren Effect (recorded at 33 seconds) is eliminated, and absorbance data are obtained when chemical reactions are close to equilibrium. However, absorbance values are higher in DI compared to SW calibration runs, as it is confirmed in corresponding calibration graphs (G, H).
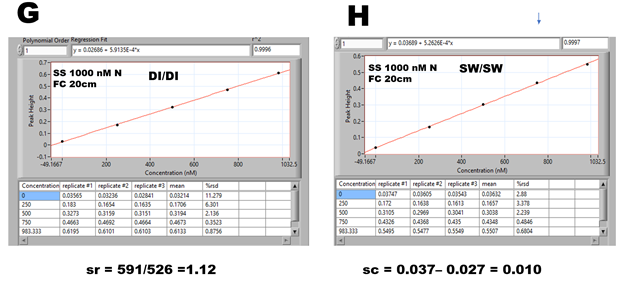
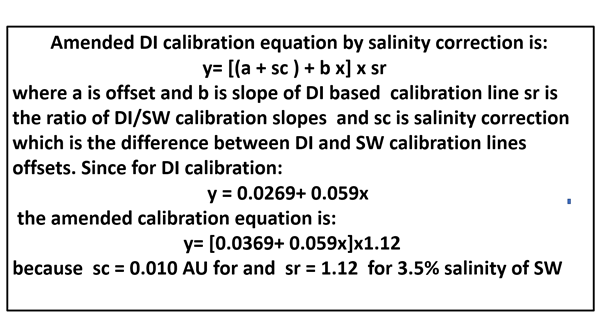 The ratio of slopes of DI/SW calibration lines (sr = 1.12) and difference in offsets of calibration lines (sc = 0.010) were used to amend the DI calibration, which was used to calculate the content of nitrite in sea water samples spiked in the range of 0 to 787 nM N.
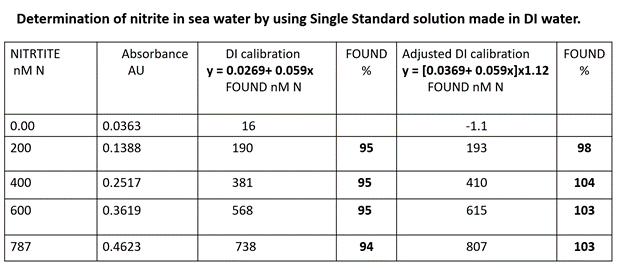
Spiked SW samples were analyzed by using assay protocol (D) modified by removing the lines within blue shaded areas and by replacing the values as indicated by the blue arrow. Samples were analyzed in triplicate, and their mean values are listed in column 2 above. To illustrate the difference between DI calibration (column 3) and the amended calibration (column 5), the found values (F%) were calculated. For DI calibration, the mean F value (95%) indicates underestimation, while for amended DI calibration the mean F value (102%) indicates an overestimation. However, since it is recognized that reproducibility of spectrophotometric determinations is 3% R.S.D., and therefore both calibrations are within the accepted error of this method.
Replacing SW matrix
Composition of SW matrix is not well defined, because samples collected at different localities differ in concentration of macro and micro components. Even Low Nutrient SW prepared from surface water collected in open ocean where salinity is constant (3.5%) may vary in content of micronutrients. It may also change in composition unless carefully prepared and stored. Therefore the use of equivalent well defined substitute is not only desirable, but its use will be more convenient.
Substitute matrix (SM) should influence the calibration method in exactly the same manner as the inherent sample matrix. Therefore to validate feasibility of the use of SM, the SW samples shall be analyzed by DI calibration amended by sr and sc values obtained with SM based calibration. The calibration graphs shown below were obtained in the same way as described above (G, H) albeit that sea water was replaced by 3.5 % NaCl solution prepared in DI water.
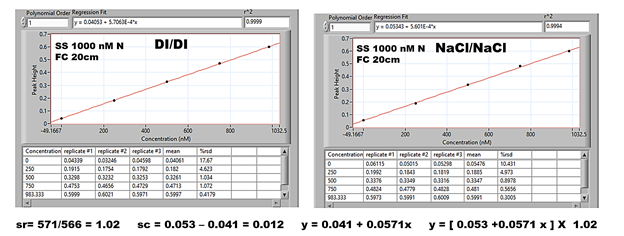
The sc value obtained as ratio of DI/NaCl calibration line slopes and sc value obtained as difference in DI and NaCl calibration lines offsets was used to amend DI based calibration line.
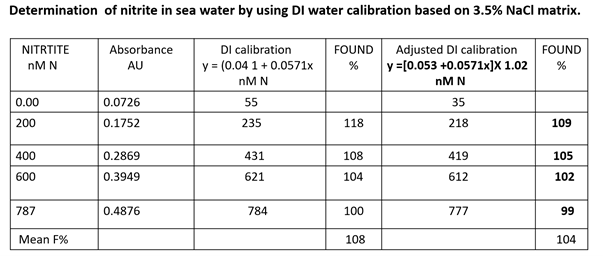
To illustrate the difference between DI and NaCl amended calibration SW samples were spiked with known amounts of nitrite (0 to 887 nM N), and the results are presented in the Table above.
DI based calibration (Table above, column 4) results in overestimating the mean value of which is 8% (bottom row).
The NaCl based calibration (column 6) results in a lower overestimate (4% bottom row), which may be viewed as insignificant because it is close to 3% R.S.D. of the method. It equals to 16 nM N since all nM N values in column 5 will all become close to 100% F when reduced by this concentration.
Conclusion
Thus it is affirmed that the amended DI calibration can be used to calculate analyte content in different matrices provided that the assay protocol is designed to function in batch mode where equilibrium conditions are reached. Also the matrix inherent to samples to be analyzed can be substituted by material of similar properties.
M. Hatta, J. Ruzicka, C. Measures, M. Davis, Automated calibration by a single standard solution prepared in deionized water by flow programming eliminates the schlieren and salinity effects and is applied to the determination of phosphate in sea water of different salinities, Talanta, 253 (2023) 124041.