3.2.8.3. Calibration for Absorbance
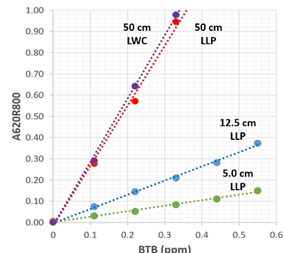
Sandwiched between black blocks that secure the illuminating and CCD optical fibers, the green PEEK tubing serves as the Long Light Path flow cell for absorbance monitoring. The entrance into thus formed Z flow path is connected to lab-on-valve while its exit atop connects to 40psi Flow Restrictor that prevents outgassing of the carrier stream. Since absorbance values are increasing linearly with the length of illuminated flow path 5 cm to 50 cm flow cells we used to enhance sensitivity of determinations. The LLP cell used here is 10 cm long and has internal volume of 50 microliters. As in the case of fluorescence, LLP cell performance is evaluated by autocalibration protocol that generates calibration line graph by graph by autodilution of solution of bromothymol blue (BTB). This yields information on reproducibility, sensitivity and linearity of instrument response. The protocol is designed to simulate single reagent assay where carrier and Reagent are DI water.


Setting up USB 4000 UV-VIS Ocean Optics Spectrophotometer
By using DI water as a carrier flush holding coils reagent line, sample line, container, and flow cell. Then perform the following steps:
- Set up all values as shown on Setup panel. On Run panel set A620-A750 Absorbance.
- With ALL light sources OFF press “Get Dark Spectrum”. This will set DI baseline close to zero A value.
- Switch Halogen/Tungsten light ON. Regulate integration time until spectrum on panel 3 looks as shown. (You may also use AutoTune).
- Press “Get Reference Spectrum” This will bring the baseline over the whole spectral range to zero absorbance.


Calibration for Bromothymol Blue by Absorbance

Calibration for Bromothymol Blue by Absorbance
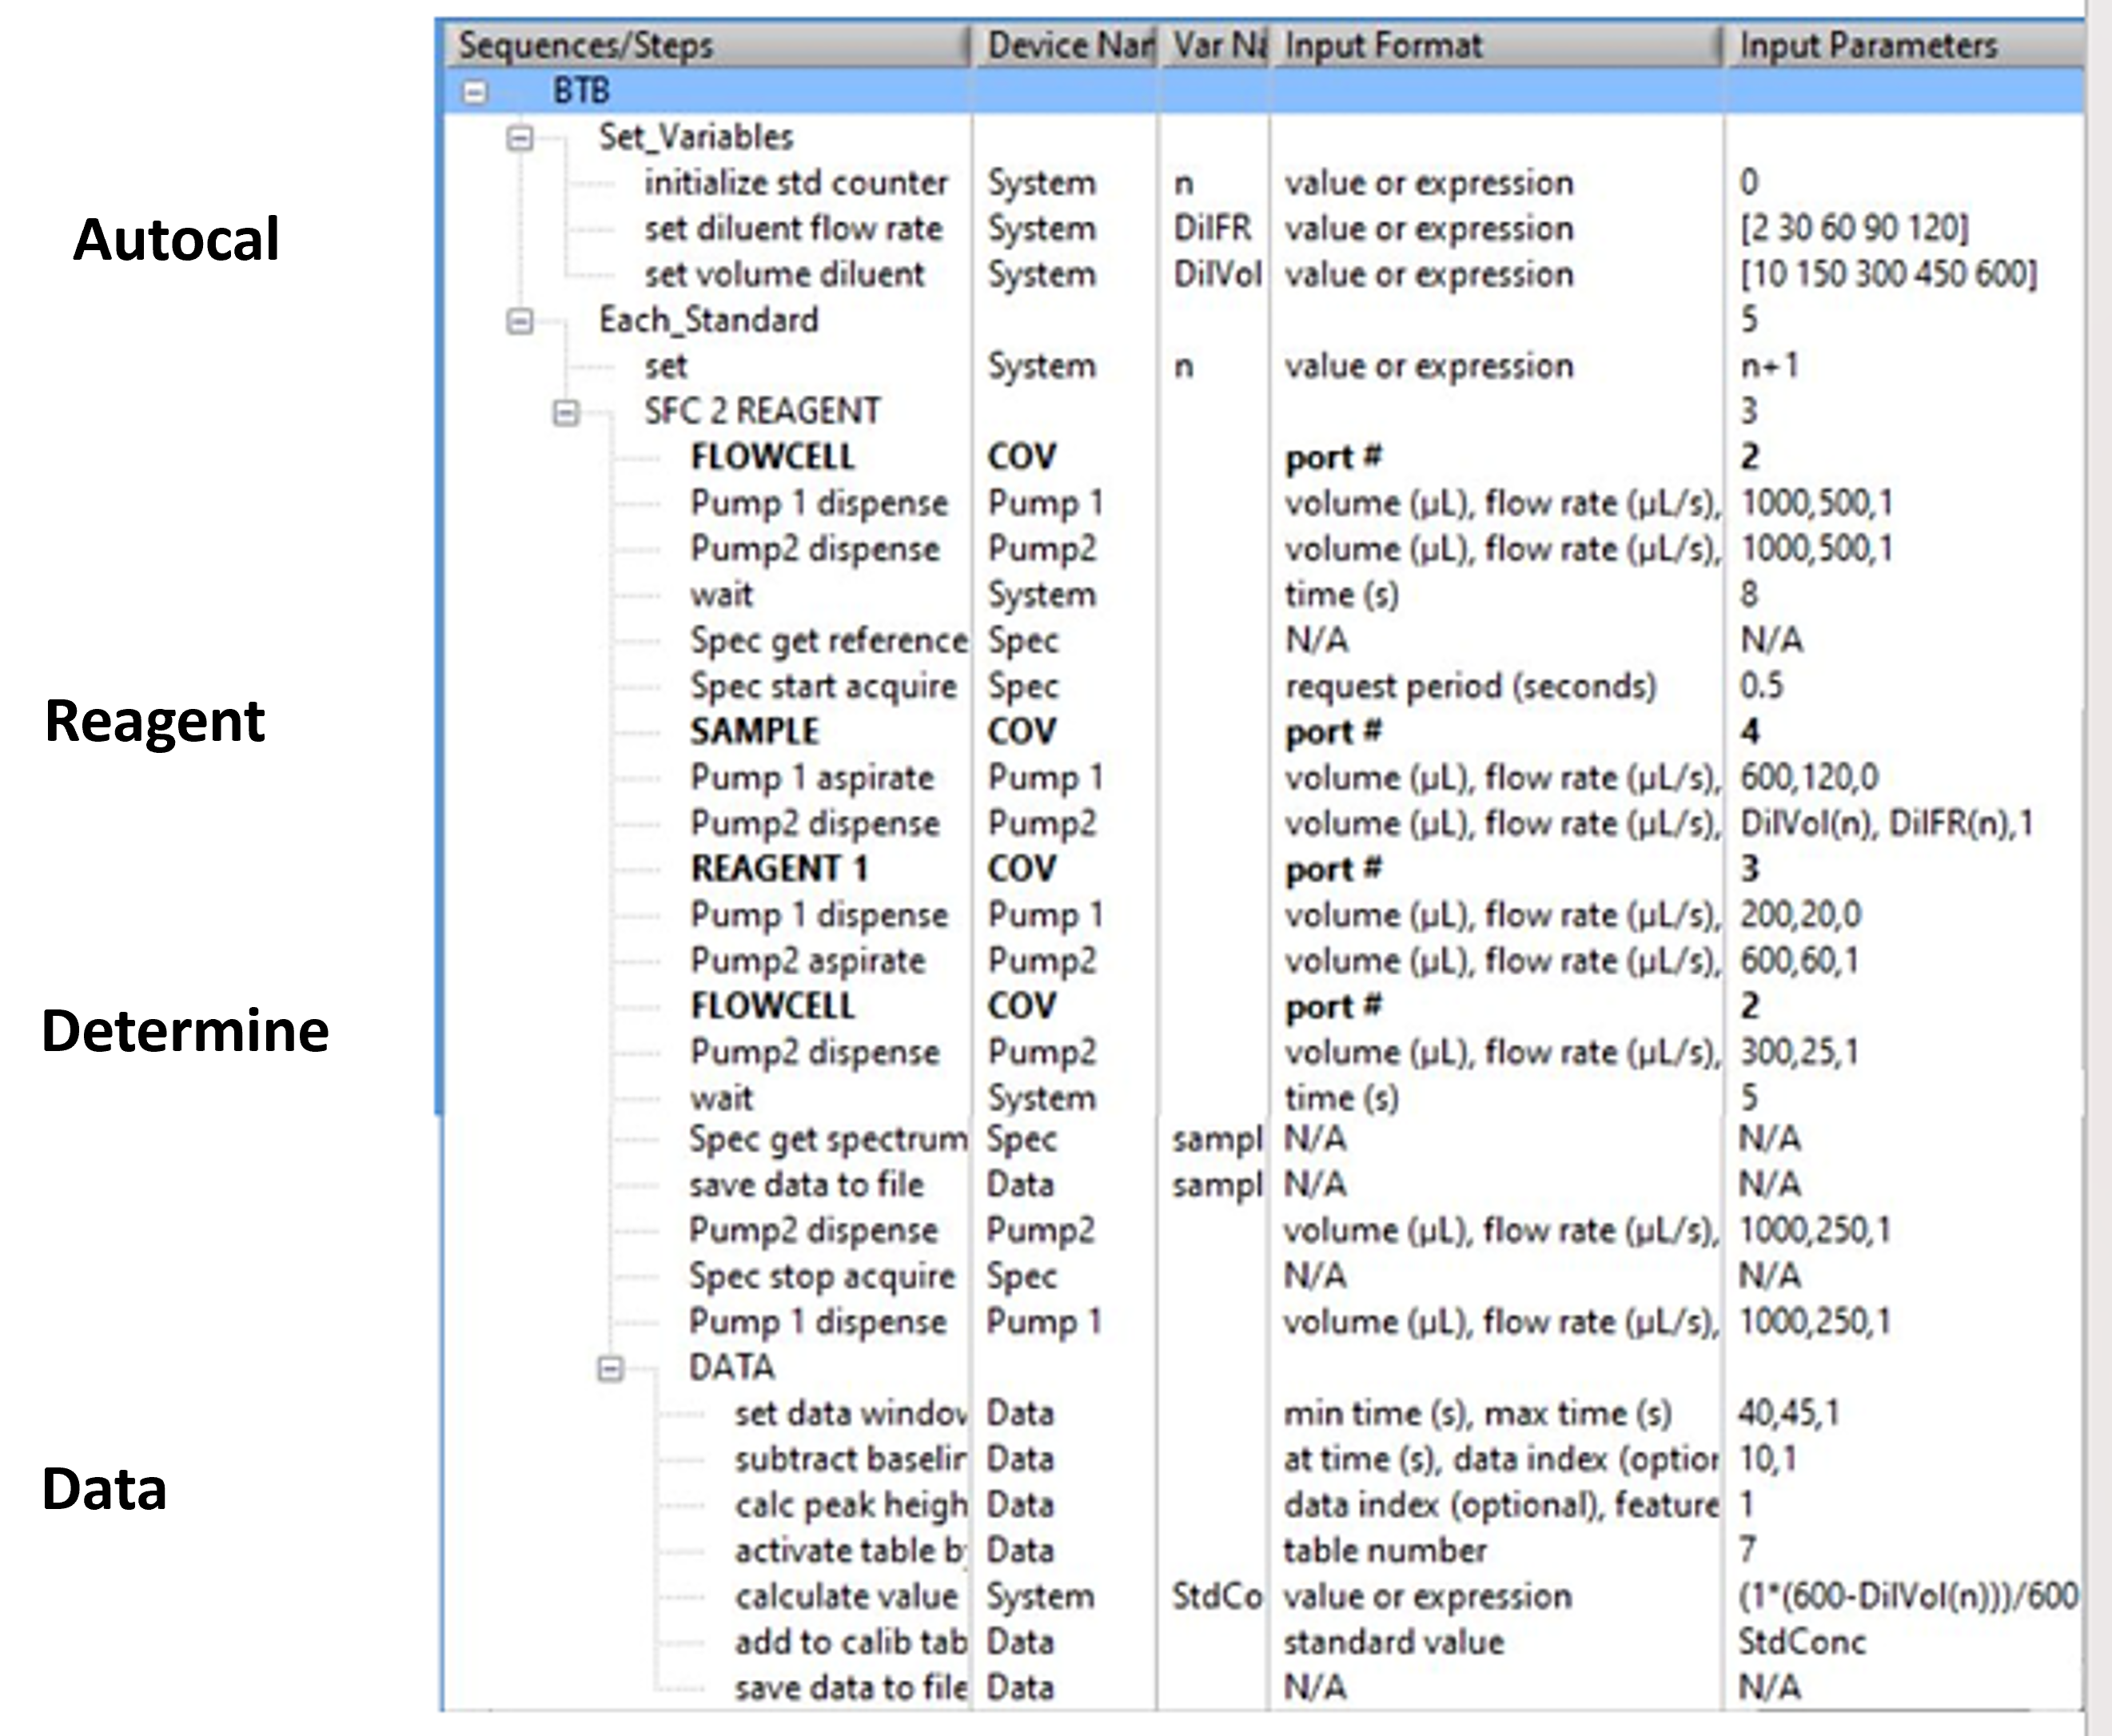
The software protocol shown in previous figure, designed for autocalibration by autodilution of single standard solution of bromothymol blue (100 ppb of BTB in 0.01M Na borate buffer pH 9.5), was used to generate results shown below. Panel on the left show absorbance values recorded while progressively diluted zones of dye are arrested in the flow cell. The data collected during WIN period were used to generate absorbance spectra and the calibration graph. The strictly linear calibration spans the range up to A=0.80 with baseline A=0.00, while the light path was 10cm long (volume 50 microliters). LLP cells with light paths between 5 and 40cm perform in similar way.
.png.aspx?width=800&height=326)
Construction of Flow Cell for Absorbance
.png.aspx?width=800&height=441)
Green PEEK tubing (1/16” O.D. (1.6mm) x 0.03” I.D. 0.8 mm) and blue ferrules along with fittngs were purchased at IDEX Health & Science, LLC, Oak Harbor, WA, USA. All other components of Hybrid Flow Cell were made by Global FIA, Fox Island, WA. USA.
