3.3. Bead Injection and Flow Programming
Bead Injection (BI) was designed to:
- preconcentrate an analyte with aim to increase sensitivity of determination
- automate Sorbent Extraction in microscale
- study ligand interaction at liquid solid interface
BI is based on metering of suspension of micro beads into a flow channel, where the beads are trapped at selected location. Next, a sample zone is injected and perfused through the bead layer, while sample components react with functional groups on the bead surfaces. Retained analyte molecules are quantified on beads or are eluted and quantified by spectrophotometry or fluorescence, (Ruzicka 1993,1994). As needed, beads can be transported by flow reversal into a different location or discarded to waste. There are four key components of BI method:
- Flow programming is designed to transport beads at high flowrates and flow reversals, at low flowrates when target analyte is captured and at moderate flowrates for elution. While flow programming in SI mode was successfully used in many BI protocols, the pFI configuration will allow increase of processed sample volumes resulting in increase in sensitivity of preconcentration based determinations.
- Lab-on-valve platform with smooth short channels of uniform diameter (0.8mm I.D.) integrated with fiber optic flow cell
- Flow cell designed to capture beads upstream from 30 µm wide circular gap between the sheet of optical fibers and conduit wall.
- Spherical and rigid polymeric beads with diameter between 50 to 100 µm, furnished with appropriate surface properties (ligands, functional groups).
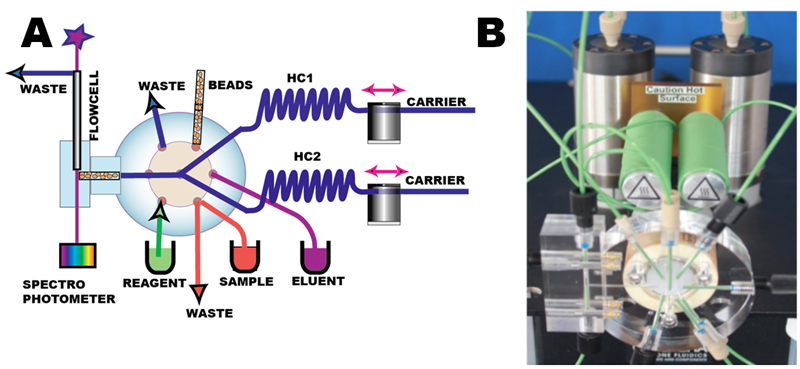
Flow Injection (pFI) manifold (A, B) comprises two milliGAT pumps, two holding coils (HC1, HC2), lab-on-valve module, microcolumn module and flow cell.
 The bead suspension is aspirated via port # 6 into the holding coil by flow reversal. After the valve is switched to port #2, the beads are packed, and retained by an optical fiber (C, D). Bead transport is carried out at moderate flow rates (100 µL/sec), in order to transfer all beads within the selected volume of suspension through the flow channel and to pack them reproducibly into the flow cell. It was found that slower flow rates do not provide well packed microcolumn. Bead perfusion by sample solution is carried at slow flow rates (typically at 5 µL to 15 µL/sec). Bead discharge takes place as needed, by means of high flow rate reversal (200 µL/sec) into the holding coil, followed by forward flush into waste after the valve switch. The unique advantage of the frit less microcolumn is a very low flow resistance that allows fast flowrates to be used for column washout and packing and for automated renewal of stationary phase.
The microcolumn, sandwiched between LOV module and flow cell, is 10 mm long and 1.6 mm I.D. Movie clip (C) shows removal of microcolumn by flow reversal and packing of beads by forward flow. Movie clip (D) shows loading of protonated, yellow form of bromothymol blue on OASIS HLB water wettable beads. The negatively charged blue form is eluted by Me/NaOH solution.
C
D
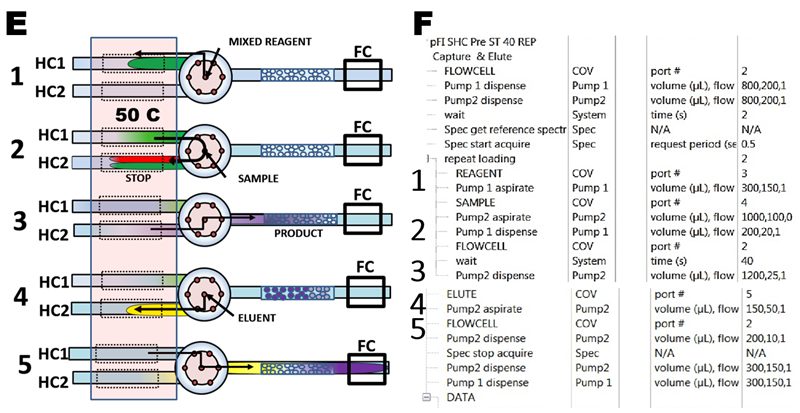
Determination of phosphate in nanomolar range by mixed molybdate ascorbic acid reagent was automated by five steps protocol shown in flow diagram (E) and in software script (F) :
- 1) reagent is aspirated into holding coil (HC1)
- 2) valve is turned to sample port and 1000 µL is aspirated into the second holding coil (HC2), while 200 µL are delivered from HC1 trough the confluence point resulting in 4+1 sample reagent mixture in HC2. The mixture is incubated for 40 seconds.
- 3) Valve is turned towards flow cell and reaction mixture is loaded on the microcolumn.
- 4) eluant is aspirated into HC2.
- 5) PMoB is eluted into the flow cell, where a transient signal (peak) is monitored. Finally, all channels and microcolumn are rinsed with carrier.
Optimization of assay protocol, influence of temperature and incubation time as well as reagent composition are detailed in Tutorial.
 Peak height of eluted analyte obtained by repetitive loading of 800 µL sample (G, H) increases linearly with number of loadings and so does the slope of calibration response that for two loadings is linear down to 1 ppb P (31 nM P). However, blank and 0.5 ppb P points are above the level of calibration line due to presence of phosphate in reagents and in DI water. This reagent blank is the drawback of preconcentration method as it accumulates target analyte from sample as well as from reagents. Low sampling frequency (12 s/hr for two loading cycles) is yet another disadvantage of this method, which is, however, presently the only way how to quantify phosphate at low nanomolar concentrations.
 Determination of traces of iron, performed in BI format by accumulating ferrozine (FeII) complex on Oasis HLB beads, yielded linear calibration down to 0.2 ppb Fe (3.4 nM Fe) after 180x preconcentration reached LOD = 1nM Fe. In summary, preconcentration in BI format is a simple robust technique that yet has to be applied to real life determination.
This is because advantages of BI format, miniaturization and automated replacement of sorbent, compared to conventional cartridge format, makes BI method ideally suitable as a sample preparation “front end” to LC-MS.
Sorbent Extraction has been automated in BI format and applied for trace analysis in oceanography and environmental studies (Miro 2008, 2014,Horskotte 2016).
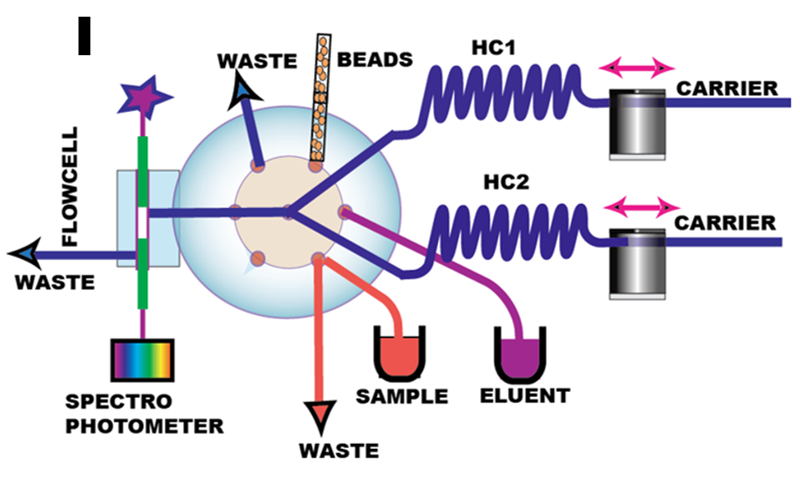
BI spectroscopy provides real time monitoring of target analyte as it is being accumulated on solid phase. The key component of the experimental setup (I) is the flow cell integrated with lab-on-valve module. The axial flow configuration shown here (J) is the simplest of several alternatives: the analyte, accumulated on top layers is monitored by light beam projected by upper optical fiber. The carrier solution flows from LOV on right, turns vertically into bead layer and proceeds to waste line (not shown on bottom left) trough circular 50 micrometer gap between green cladding of the bottom optical fiber and of the flow cell conduit.

J
The (J) shows capture of pink Fe(II) ferrozine complex on OASIS HBL polymeric beads and its elution by Me/NaOH solution. The quantity of beads and thickness of bead layer is controlled by metering the volume of bead suspension. OASIS polymeric beads are available in right size (50 µm) and microcolumn made of this material can be used repeatedly for many assay cycles. Initially designed as alternative to elution based method, BI spectroscopy, while robust and simple, turned to be less sensitive (K ,L) then elution based BI because retention of analyte on smaller amount of beads held within the flow cell is less efficient. Use of longer column in a flow cell is limited by low translucency of polymer based beads and intensity of available light source (3.4.3.A.).
 In summary, BIS on axially illuminated column yields data which are well reproduced, (L) while absorbance measurements collected through a measurement cycle are essentially noise free (K). Therefore, BIS found applications as a research tool for:
- bioligand interaction assays (3.4.4.)
- immobilization of proteins (3.5.3.)
- binding capacity of bioligands (3.5.11.)
- cellular metabolism (3.5.18.)
- study of pharmaceutical antagonism (3.5.17.)
Bioligand interaction assay (ligand binding assay LBA) measures the binding ligand molecules to antibodies, receptors and other macromolecules, A detection method is used to determine the presence and extent of the ligand-target complexes formed, and this divides LBA into two groups depending if the ligand is labeled (by radioisotope, fluorescent tag, etc.) or, preferably, nonlabelled when target can be quantified in its native form (Rohtla 2022).
Surface Plasmon Resonance does not require labeling of the ligand, because it measures the changes of refractive index by monitoring change in the angle at which the polarized light is reflected from a thin layer of metal deposited on the opposite side of glass plate, which is exposed to measured solution. This change in angle is related to the change in mass of bioligands covering the metal. The first SPR immunoassay was proposed in 1983 by Liedberg, Nylander, and Lundsrom. They adsorbed human IgG onto a 600-angstrom silver film, and used the assay to detect anti-human IgG in water solution. The sensing “chip” furnished with ligand was mounted in a flow cell and exposed to various concentrations of anti- IgG by microfluidics.
When the affinity of two ligands has to be determined, the equilibrium dissociation constant must be determined. It is the equilibrium value for the product quotient. This value can be found using the dynamic SPR parameters and, as in any chemical reaction, it is the dissociation rate divided by the associate required labeling of the ligand.
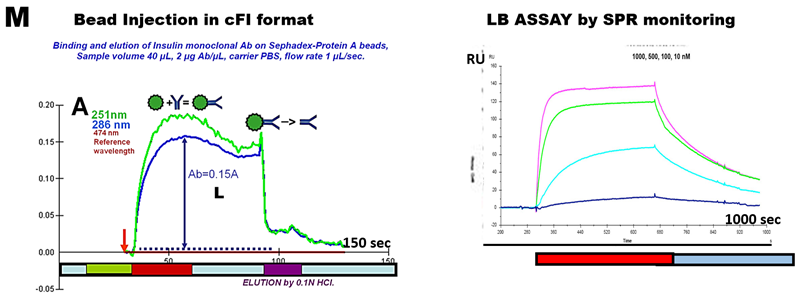
For dynamic SPR, a ligand is immobilized on the dextran surface of the SPR chip. By means of FI system, a solution analyte is injected over the ligand layer. As the binding takes place, an increase in SPR signal is observed. After desired association time, a solution is injected on the chip that dissociates the bound complex (M). From these association ('on rate', ka) and dissociation rates ('of rate', kd), the equilibrium dissociation constant ('binding constant', KD) can be calculated.
 There is, however, yet another well established method for monitoring of biomolecules in their native form, spectrophotometry in UV region. And there is a wide variety of ligands available on Sepharose or Sephadex beads, which, having high water content are transparent. In the past preliminary experiments shown that LBA is feasible in cFI format (M). With advent of pFI which is suitable for determination of dissociation constant in batch mode as well as in dynamic mode, there is opportunity of conducting innovative research by applying BI in pF format for bioligand interaction studies. An excellent guide to theory, application and pitfalls of BLA is a primer, reading of which highlights potential advantages of applying BI format for bioligand interaction studies. An excellent introduction to theory applications and pitfalls of Ligand Binding Assays is the “The Guide to Simple and Informative Ligand Binding Assays” Reading of this work will serve as a primer and will lead to appreciation of yet unexplored advantages and opportunities that programmable FI in batch mode offers to LBA method.
Ruzicka, J.; Pollema, C. H.; Scudder, K. M., Jet ring cell: a tool for flow injection spectroscopy and microscopy on a renewable solid support. Analytical Chemistry 1993, 65 (24), 3566-3570.
Růžička, J., Tutorial review. Discovering flow injection: journey from sample to a live cell and from solution to suspension. Analyst 1994, 119 (9), 1925-1934.
Miró, M.; Hartwell, S. K.; Jakmunee, J.; Grudpan, K.; Hansen, E. H., Recent developments in automatic solid-phase extraction with renewable surfaces exploiting flow-based approaches. TrAC Trends in Analytical Chemistry 2008, 27 (9), 749-761.
Miró, M., On-chip microsolid-phase extraction in a disposable sorbent format using mesofluidic platforms. TrAC Trends in Analytical Chemistry 2014, 62, 154-161.
Horstkotte, B.; Chocholouš, P.; Solich, P., Large volume preconcentration and determination of nanomolar concentrations of iron in seawater using a renewable cellulose 8-hydroquinoline sorbent microcolumn and universal approach of post-column eluate utilization in a Lab-on-Valve system. Talanta 2016, 150, 213-223.
Liedberg, B.; Nylander, C.; Lunström, I., Surface plasmon resonance for gas detection and biosensing. Sensors and Actuators 1983, 4, 299-304.
Rohtla, R.; Kivirand, K.; Jõgi, E.; Rinken, T., Biosensor for the Detection of Cyanobacterial Toxin Microcystin-LR. In Biotechnology - Biosensors, Biomaterials and Tissue Engineering - Annual Volume 2022, Dr. Luis Jesús, V.-G. Ed.; IntechOpen, 2022; p Ch. 1.