Optimizing FI at continuous flow
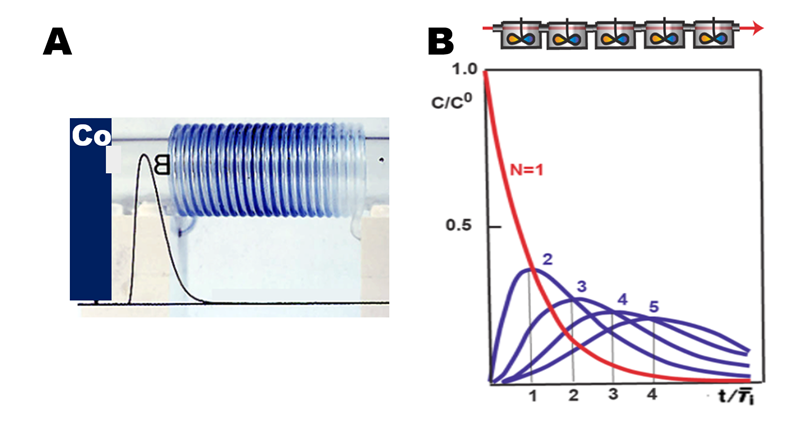
The initial, square pulse input (A) delivered by injection of a dye of concentration Co disperses into concentration gradient C, with maximum dye concentration Cmax at the apex of the peak. Since FI method is based on peak height measurement it is useful to define dispersion coefficient as D = Co/Cmax because it provides information how much the sample dispersed in during transport into detector. The shape of the peak provides information on ratio between axial and radial dispersion and thus on efficiency of mixing sample with carrier stream. As explained previously (1.2.) sample injection forms a hollow, bullet shaped, three-dimensional concentration gradient resulting in a sharp, asymmetric peak with long tailing section. However, when such an initially square input passes through a series of stirred tanks (B) it will reform into a concentration gradient, the shape of which range from exponential (N = 1) to Gaussian (N = 10).
 The parameters of this model are N - the number of mixing stages, through which the element of fluid has passed, and the mean residence time of the element of in one mixing stage. For one tank the normalized C curve is:

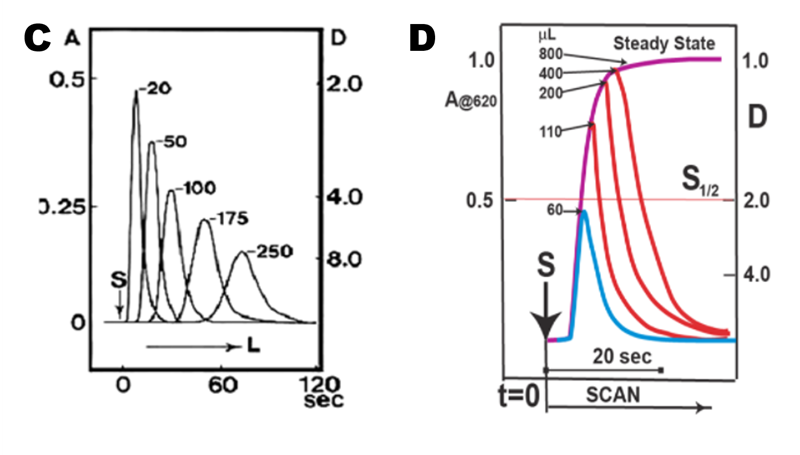
Responses obtained by injection of 60 µL of bromothymol blue solution into 0.5 mm I.D. of coiled tubing, 20 to 250cm long, at a flow rate of 1.4 mL/min monitored by spectrophotometry at 620 nm show how Increasing the length of channel decreases the peak height, while the peak shape gradually changes from asymmetrical to symmetrical (C). At the same time, the resident time of the peak maximum increases with the distance traveled, and the peak base broadens. While D value indicates that passage through 20 cm long conduit resulted in dispersion of sample by carrier 1+1, peak symmetry and sufficient radial mixing was obtained in 100 cm long channel at D = 4. At a mean flow velocity of 23 µL/sec and channel volume 200 µL complete mixing was obtained after 10 seconds of mean residence time. Obviously coiling alone is not very efficient tool for breaking laminar flow pattern.
 The step input passing through single mixing stage will yield an F-curve with exponentially rising edge. Such response is obtained by injecting dye into colorless carrier stream flowing at a rate of 1.5 mL/min through 20 cm long, 0.5 mm I.D. tubular conduit (D). For a large sample volume Sv = 800 µL (dark red trace) the measured absorbance rises until the steady state is reached when the channel between injector and outlet of flow cell is entirely filled with undiluted due. At this level, the absorbance Cmax = Co and dispersion coefficient D = 1. Repeated experiments with decreasing Sv yield series of decreasing peaks the rising edges of all these F-curves coincide and therefore:
 Where n = Sv/ S1/2 and S1/2 is the volume of sample solution necessary to reach 50% of steady state value (D = 2). By injecting two S1/2 volumes 75% of Co is reached and so on. Although D = 1 can never be reached ( as much as fast footed Achilles can not capture turtle by halving distance between them), it is sufficient to inject 5 S1/2 volumes to come within 3% of steady state level, when flow channel and flow cell are filled with undiluted dye. Since the tailing edge of F-curve is a mirror image of its leading edge it follows that it requires 5 S1/2 volumes of carrier solution to washout all sample material - a necessary condition for preventing carryover due to commingling adjacent samples. Therefore, optimizing performance of FI system is facilitated by minimizing S1/2 volume as it reduces reagent consumption, waste generation and increases sampling frequency.
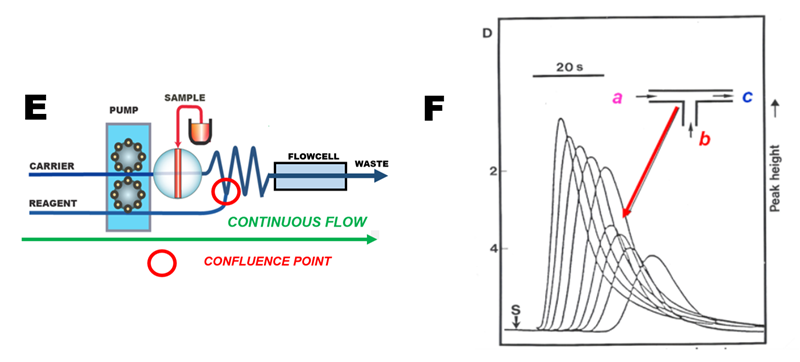
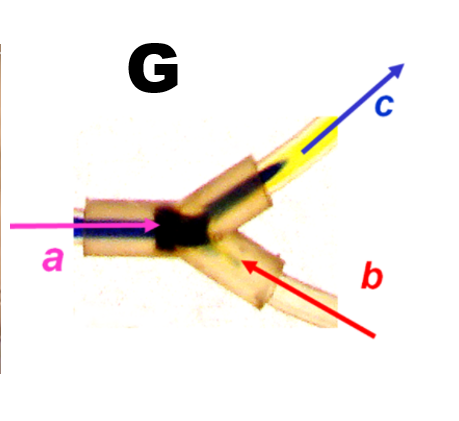
While mixing by confluence is the key component of flow injection manifolds (E), it is not generally recognized how efficiently is the laminar flow broken by merging two streams. Series of peaks recorded with dye injection into increasing length of coiled tubing where a confluence point was included, shows immediate drop of peak height when colorless stream is merged with dye zone in ratio 1+1. (F). Note that at confluence point dispersed sample zone is evenly mixed along its entire length with merging stream at ratio equal to flowrates of merging streams. Mixing at a confluence point is instantaneous and complete as visualized here (G) by merging zone of bromothymol blue (a) in basic form with stream of acid (b) converting blue dye completely into yellow, deprotonated form (E).

 Confluence in Flow system video