3.2.5.3. Limit of Detection Determined by Autocalibration
Limit of detection (LOD) is widely used to estimate performance of a method aimed at determination low concentrations of target analyte. LOD is the lowest concentration of analyte in the test sample that can be with confidence distinguished from zero. It is calculated from mean value of blanks y, standard deviation s (r.s.d) and the sensitivity of measurement (the slope of calibration line b). Thus for 95% confidence limit LOD = (y × 3.2 × s)/b. These values are obtained by analyzing a number of solutions prepared manually, by serial dilution of a standard solution (SS) of a known concentration.
Automated Single Standard Calibration offers an efficient and convenient approach to calibration and determination of LOD value.
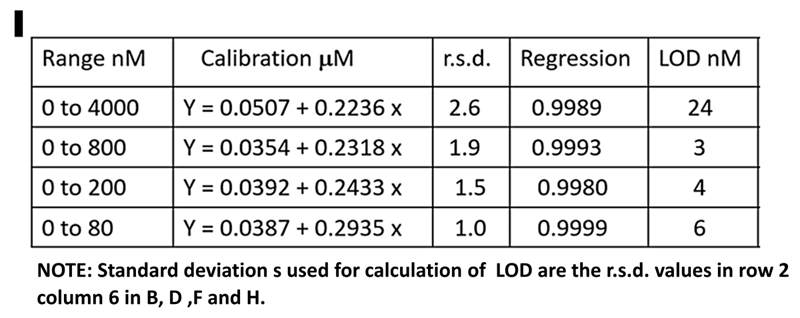
Spectrophotometric assay of nitrite, detailed in section 3.2.2. is used here to illustrate the approach, by performing autocalibrations covering ranges 0-4000, 0-800, 0-200 and 0-80 nm N. All measurements were conducted within the same day at exactly same conditions: concentration of Griess reagent, temperature (40 C), by using the same instrument and assay protocol.
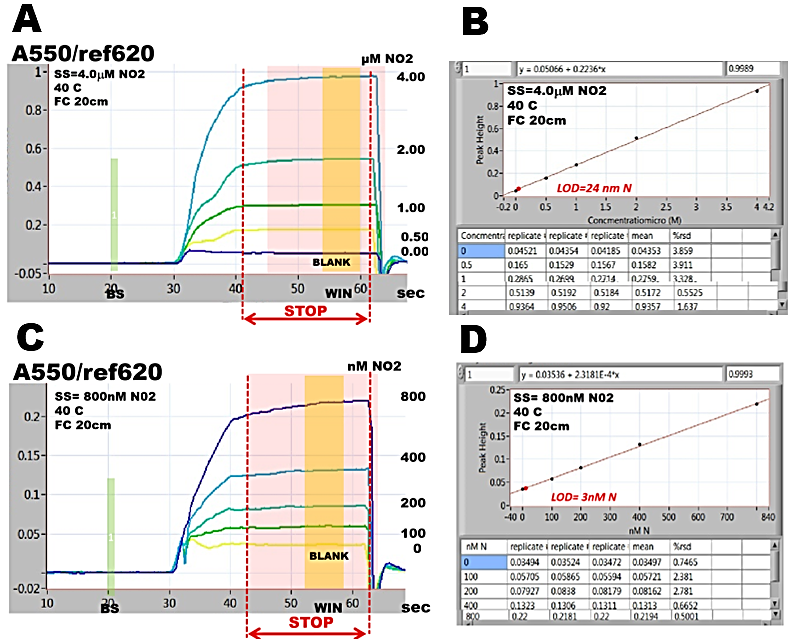
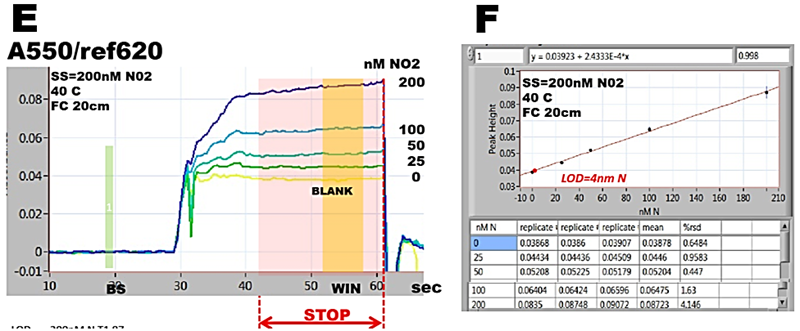
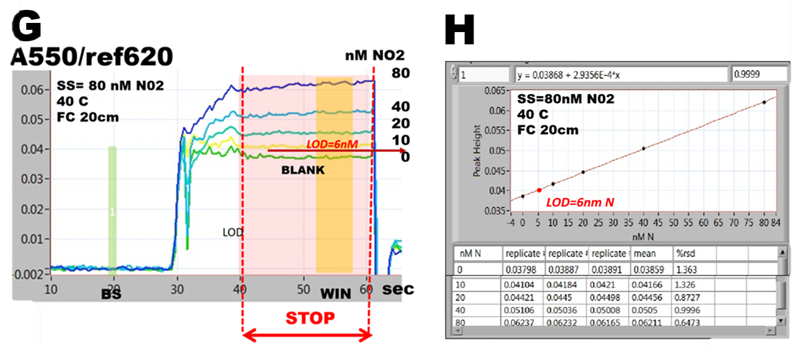
Absorbance values, collected form calibration runs (A,C,E,G), during stop flow period (WIN) tabulated in calibration graphs (B,D,F,H) yield slopes, intercepts and LOD values, that are almost identical (I). This is because the calibration response within 0-4000 nM range is linear (r2= 0.9989) and lower ranges are sub sections of this line. In ranges below 800 nM LOD values are identical because mean values of BLANKS as well as r.s.d values are low and similar (row 2, column 5 and 6, B,D,F,H).


 Variations of absorbance during stop flow period become gradually more visible as concentration ranges of analyte decrease (A to G). In 80nM range (G) it can be seen that variations of absorbance at baseline and BLANK are the same, approximately 1 to 2 mAU. Since at baseline (BS) the flow cell is filled with DI water, it is the variation of spectrophotometry that determines LOD of this assay, not value of reagent BLANK. And therefore LOD value is higher than absorbance of BLANK (G).
For ε = 4.6E04 (molar absorptivity at 550 nm) 20 cm long flow cell and 30% dilution of sample with reagent, while assuming r.s.d. 2% fig. 252.C step 2), variation of A = 2 mAU corresponds to LOD= 4.2 nM N (I).

In summary optimized LOD value can be calculated a priori from value of molar absorptivity, length of a flow cell and sample dilution by reagent, by using uncertainty of absorbance measurement (+/- 0.002 A in the above experiments). This information can serve as a useful benchmark beyond which the performance of a method can not be further improved.
However, reporting of LOD as figure of merit should be supported by calibration data, because they provide more reliable information.