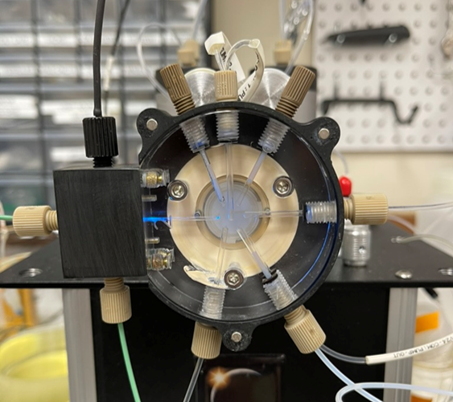
3.2.8.2. Calibration for Fluorescence
Setting up USB 4000 UV-VIS Ocean optics Spectrophotometer.
By using DI water as a carrier flush holding coils reagent line, sample line, container and flow cell. Then perform the following steps:
-
Set up all values as shown on Setup panel and Emission wavelength (F550) on Run panel.
- With LED light source OFF press “Get Dark Spectrum”. This will set DI baseline close to zero count.
- Switch LED on (450nm). Regulate intensity of LED light to reach between 15000 and 20000 cps. If cps is too high decrease integration time, if too low remove spec. entrance slit.
- Press “Get Reference Spectrum” This will bring the baseline (with FC filled with DI) close to 0 cps over the entire spectral range.


Calibration
Performance of hybrid flow cell is evaluated by running an autocalibration protocol that generates five point calibration line by autodilution of the most concentrated solution of a dye. This yields information on reproducibility, sensitivity and linearity of instrument response. The protocol is designed to simulate single reagent assay where carrier and Reagent are DI water and Sample is a buffered solution of a dye, which is fluorescein for fluorescence and bromothymol blue for absorbance measurement. The fluorescence HFC is constructed and evaluated in the next section.


Calibration for Fluorescein by Fluorescence
The software protocol shown in previous figure, designed for autocalibration by autodilution of single standard solution of Fluorescein (74 ppb in 0.01M Na acetate buffer pH 4.5), was used to generate results shown below. Panel on the left show fluorescence intensity recorded while progressively diluted zones of fluorescein are arrested in the flow cell. The data collected during WIN period were used to generate emission spectra and the calibration graph. The strictly linear calibration spans the range up to 35000 cps with baseline at 196 cps. The same experiment, albeit with PMT detector resulted in the same sensitivity and LOD as with CCD.

Calibration for Aluminum by Fluorescence
The autocalibration protocol shown above includes 20second STOP FLOW period during which aluminum + reagent mixture is incubated @ 50C in the holding coil Next reacted mixture (close to equilibrium) is held in flow cell for 20 seconds during which data are collected during WIN period, to be used to generate results shown below. Panel on the left shows intensities of fluorescence recorded, while progressively diluted zones of Al-lumigallion complex are arrested in the flow cell. The data collected during WIN period were used to generate emission spectra and the calibration graph. The strictly linear calibration spans the range up to 29000 cps with baseline at 1840 cps. However, by replacing Al standard with 0.01 M EDTA baseline count dropped to 662 cps since Al present in the reagent was complexed. Further information in Tutorial.

Construction of Flow Cell for Fluorescence
 Green PEEK tubing (1/16” O.D. (1.6mm) x 0.03” I.D. 0.8 mm) and blue ferrules and fittings were purchased at IDEX Health & Science, LLC, Oak Harbor, WA, USA. All other components of Hybrid Flow Cell were made by Global FIA, Fox Island, WA. USA.
