3.2.4.4. Reaction rate assays in pFI batch format: Catalytic determination of manganese by malachite green spectrophotometry
M. Davis, J. Ruzicka, M. Hatta and Ch. I. Measures © April 2025
Introduction
In this section we introduce, for the first time, the reaction rate (RR) method in pFI batch format. While majority of flow-based assays are based on near equilibrium conditions, there are two reasons why an assay must be based on the initial reaction rate measurement:
- When the reaction rate is too slow to achieve a practical sampling rate
- When the concentration of a catalyst or its activity is to be determined
To reach high sensitivity and acceptable sampling frequency in flow based format, chromogenic assays must be based on chemical reactions that reach equilibria within less than 2 minutes. This is achieved by optimizing pH, reagent composition and by elevating temperature. Reaction rates of acid/base reactions and of complex formations are very fast, while rates of some redox reactions are slower and therefore need to be accelerated by addition of catalyst. Example of the former is reaction of Fe(II) by ferrozine, where equilibrium is reached within seconds. Example of the latter is the group of redox reactions, such as oxidation of the leuco form of a dye catalyzed by Mn (III) or Fe (III), which are therefore quantified by reaction rate measurement.
pFI in batch format offers several advantages for automation of RR assays because it performs measurement on homogenous well defined concentration of reactants at stop flow conditions. This will eliminate artefacts unavoidable with CFA or FIA, where monitored solution moves through flow cell (FC), where composition of reacting mixture, although in very well reproduced gradient, is difficult to know.
Malachite Green Spectrophotometry
Manganese (III) catalyzes oxidation of the leukoform of redox dyes into intensely colored product. Thus, while Malachite Green in solution remains colorless, even in the presence of oxidant, it rapidly turns into a blue/green color presence of catalyst such as Mn or Fe.
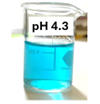 Reaction rate of oxidation of MA Green catalyzed by Mn (III) is pH dependent and maximized in narrow pH range (4.1 to 4.6) while being also influenced by temperature, concentration of NaIO4 and nitriloacetic acid (NTA).
.png.aspx)
Automated in Flow Injection format (H, G) (Bruland, Feng), the three reagent assay protocol uses sequence of merging Mn sample with ammonium acetate buffer, followed by NaIO4 solution, followed by slightly acidified MA Green solution.
In pFI format, two reagent assay protocol (A), sample is merged with ammonium acetate buffer containing NaIO4 and NTA in the second step and merged with MA Green solution in the 3rd step. Holding coils are thermostated at 60 ºC and formation of MG is promoted by preheating the sample in holding coil 2 for 10 seconds and by incubating in FC for 60 seconds, while monitoring RR. Since the sample zone is during steps 2 and 3 diluted 2+1 first with buffered reagents and next with the MG sample in FC is diluted to 50% with incubation time is 60 seconds during step 4. Further details of the flow protocol (A) and the software protocol (I) are, along with optimized composition of used reagents, and instrument, described in the Appendix.
.png.aspx?width=800&height=709)
Preliminary experiments. To optimize the flow and software protocol the following items were investigated:
- Reaction rate of oxidation of MG (B)
- Influence of temperature on oxidation of MG (C)
- Positioning of reaction mixture in FC (D)
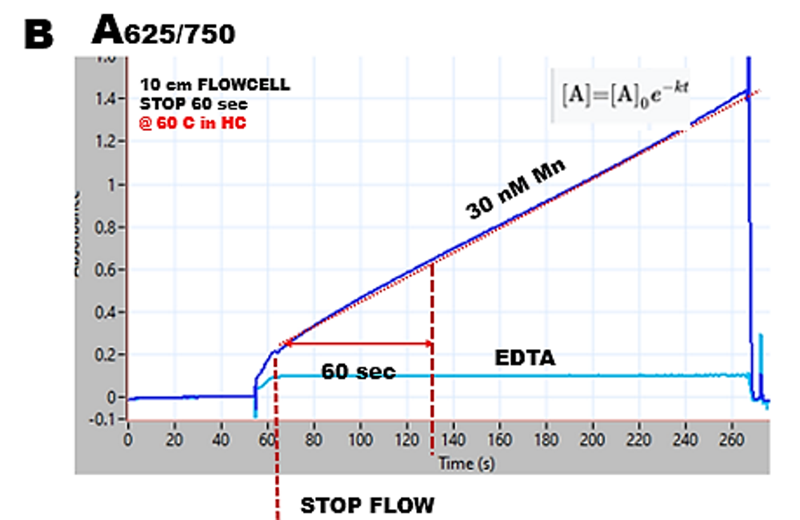
The reaction rate recorded during the stop flow period is strictly linear up to 250 sec. Therefore, the resulting calibration line will be linear, and its slope will increase in direct proportion to the length of the stop flow period. Thus, the sensitivity of Mn determination will increase with a decrease in sampling frequency. For 60 sec stop flow period, the sampling cycle will be 130 sec and sampling frequency 28 s/hr. The light blue line was recorded when a 30 nM Mn sample was replaced by a 0.001 M EDTA solution, which binds Mn (III), thus preventing oxidation of MG. This observation confirms that at optimized conditions and absence of Mn MG is not oxidized and absorbance in absence of manganese is perfectly stabilized during the stop flow period.
Reaction rate of endothermic reactions increases with increasing temperature and oxidation of MG follows this law (C).
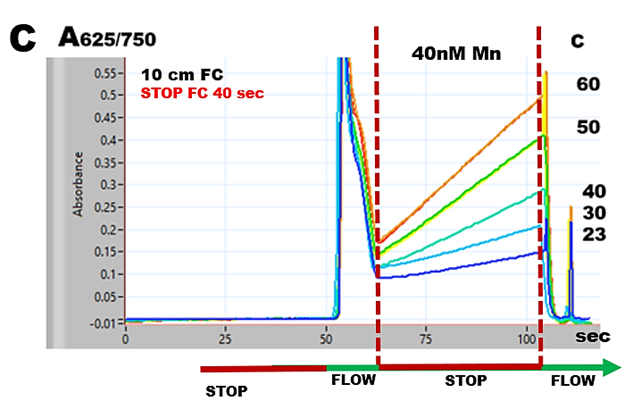
By using 40 second stop flow in flow cell, a series of 40 nM Mn samples were analyzed while holding coils were thermostated at increasing temperatures. 50 C was selected for the following experiments.
The position of reacting mixture within the flow cell is critical in pF batch mode (3.2.3.). It is the transport volume of forward flow from HC1 to flow cell (step 4) that must be optimized to operate in batch mode, and to maximize sensitivity by monitoring most concentrated, homogenous section of reacting mixture arrested in the flow cell. This was investigated by using 30 nM Mn sample, 60 seconds stop flow time in FC at 60 ºC, by recording spectra and reaction rate curves (D).
.png.aspx?width=800&height=396)
As the reaction mixture advances into the flow cell, which integrates absorbance within its volume (50 μL), the spectra (recorded at the end of stop flow period) as well as the slope of RR responses change. This is because at 200 μL transport volume, FC is mostly filled by the front boundary between DI (carrier) and the reacting mixture. With increasing transport volumes concentration of oxidized MG gradually increases, reaching a maximum at 550 μL. At higher transport volumes, absorbance decreases as the tailing section of the oxidized MG is diluted by the carrier.
Calibration and sensitivity of RR determination was investigated by using 40 nM Mn standard serially diluted by auto calibration program (3.2.5.2.), 60 sec stop flow period, temperature at 60 C and optimized reagent composition (Appendix) with mixing volumes shown in the flow chart (A) and flow protocol. Spectra recorded at the end of stop flow period (left) and corresponding calibration runs (right) are shown below (E).
.png.aspx?width=800&height=361)
When autocalibration run was completed, 0.001M EDTA sample as analyzed to obtain a recording of reagents mixture in absence of Mn (III) that was in this way removed by complexation. Thus, the difference between yellow and orange tracks shows the difference between Mn BLANK due to manganese present in reagents and residual color of MG that does not intensify during the stop flow period.
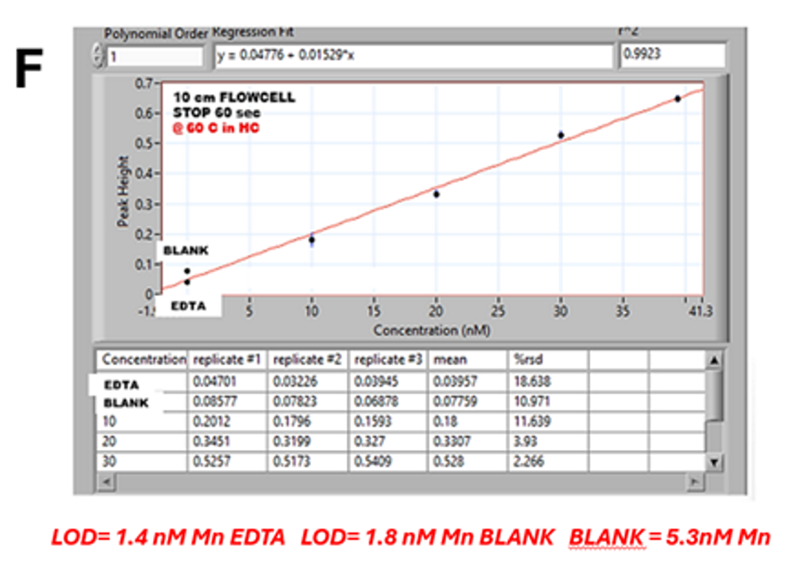
The calibration graph (F) generated by software is based on the maximum absorbance value captured within data collection window (WIN) and BASELINE (BS) in the range 0 to 40 nM Mn is linear with slope of 0.015 A/nM Mn. This yields the method LOD=1.8 nM Mn, based on difference between A values of EDTA and BLANK, which is due to 5.3 nM Mn blank in reagents. This calculation is based on observation that A value of EDTA remains constant during stop flow period and therefore does not contribute to reaction rate measurement. For further confirmation, see (G).
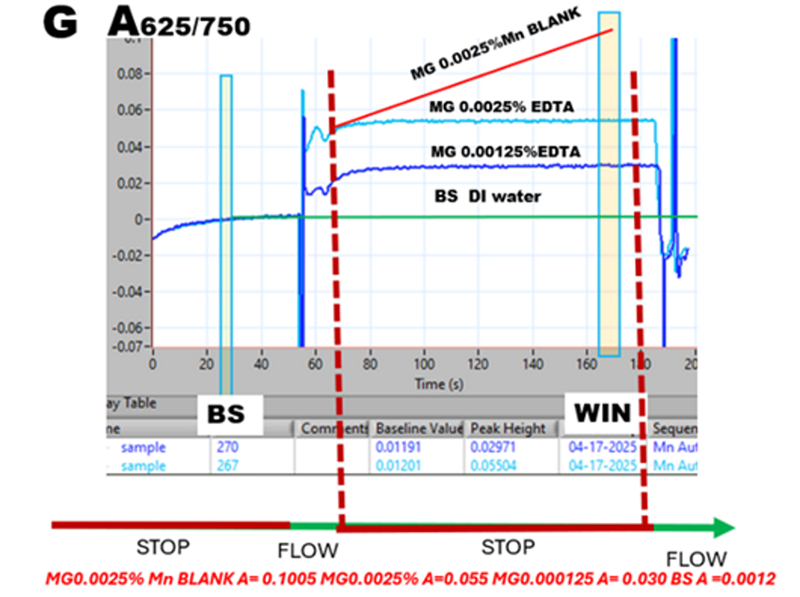
LOD is usually calculated from the differences between A values of baseline BS and Mn BLANK. However, for RR measurement using differences between A values of MG 0.0025% EDTA and Mn BLANK is justified because the A value of the former remains constant during stop flow period and therefore does not contribute to reaction rate measurement.
Malachite Green spectrophotometry, in continuous flow format, with (H) and without (I) on-column preconcentration has been used for determination of Mn in sea water with sampling rate 10 s/hr (H) and 6 s/hr (I).
.png.aspx?width=800&height=384) The RR method presented here has linear response up to 40 nM Mn and is sufficiently sensitive to cover the concentrations of traces of Mn in sea water with stop flow period of 60 seconds (slope 0.015 A/nM Fig F), and sampling frequency 28 s/hr. By increasing the incubation time in FC, sensitivity of determination can be further increased.
The RR method presented here has linear response up to 40 nM Mn and is sufficiently sensitive to cover the concentrations of traces of Mn in sea water with stop flow period of 60 seconds (slope 0.015 A/nM Fig F), and sampling frequency 28 s/hr. By increasing the incubation time in FC, sensitivity of determination can be further increased.
While these results confirm potential of RR method for determination of traces of manganese in sea water, several issues need to be addressed:
- LOD must be maintained below 1 nM Mn by reducing manganese BLANK by purification of reagents and DI water,
- Selectivity of determination in the presence of iron needs to be examined
- The influence of salinity on reaction rate must be investigated
- The method must be verified by analysis of reference materials
Appendix
.png.aspx)
The first wait time is used to heat the sample in holding coil 2, the second one promotes incubation of reaction mixture in FC. Blue box is transport volume into FC.
Reagents composition
- Buffered reagent 0.4% NTA (nitrilotriacetic acid), 0.2% NaIO4 in 0.50 M Ammonium Acetate buffer pH 4.3
- Buffered Reagent preparation. Since 0.4% NTA is approx. 0.02M, it must be neutralized by NH4OH.
- Therefore, place 50 mL DI in transparent container, dissolve 400 mg NTA, add and dissolve 200 mg NaIO4, and add 5 mL of 1M NH4OH. Add 25 mL of 2M Ammonium Acetate buffer pH 4.3 and 25 mL DI. Check pH and adjust by further addition of NH4OH to pH 4.3 to 4.6. Use pH meter. NOTE: below pH 4 the reaction rate will decrease. Above pH 5 MA Green will be oxidized.
- Malachite Green 0.003 g / 100 mL in 0.015 M HCl
- Mn Stock Solution prepared from commercial standard (1000 ppm), which is in 2% HNO3 solution, by diluting to 100 μM Mn with DI water
- Mn Standard Solution, 40 nM Mn was prepared from the stock solution by diluting with DI water.
- NOTE: Malachite Green is difficult to dissolve above 0.01%, NaIO4 is more soluble than KIO4. All reagents and Mn Stock solution are stable for at least 3 weeks at 20 °C.
Instrument
Multipurpose pFI instrument configured as shown in Tutorial 3.2.7.