3.2.7.2. Fluorescence based aluminum assay
J. Ruzicka, M. Davis, M. Hatta and Ch. I. Measures © February 2024
The key advantage of CCD measurement is that it provides, in contrast to PMT measurement spectral information in real time. For routine applications, this feature supports trouble shooting, for method development serves as valuable tool since intensity and wavelength of emitted light depends on composition of chromogenic reagents. This section documents this feature by comparing CCD with performance of PMT based method.
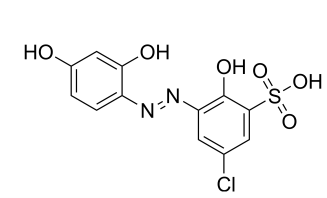
Determination of aluminum, based on its reaction with lumigallion was carried out at pH 5.5, and at 55 °C by using excitation wavelength 500 nm while monitoring emission at 595 nm (S.H. Sutheimer and S. E. Cabaniss Anal. Chim. Acta 303, (1995) 211-221. They automated the assay in continuous Flow Injection format, using Shimadzu RF535 fluorescence monitor equipped with appropriate filters and PMT detector. Their calibration had linear response and limit of detection LOD=3.7 nM Al.

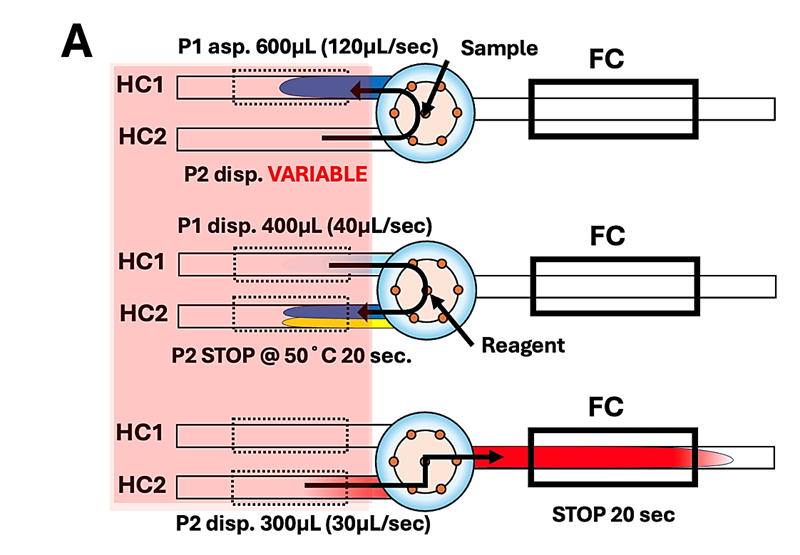
We modified their protocol into programmable Flow Injection format (A) by including two stop flow periods, of which the first one (in HC 2) is used to allow reactions to reach equilibrium at 50 °C, while the second one, when sample is in flow cell, allows use of long CCD integration time and positioning of data collection (WIN) when response has stabilized.

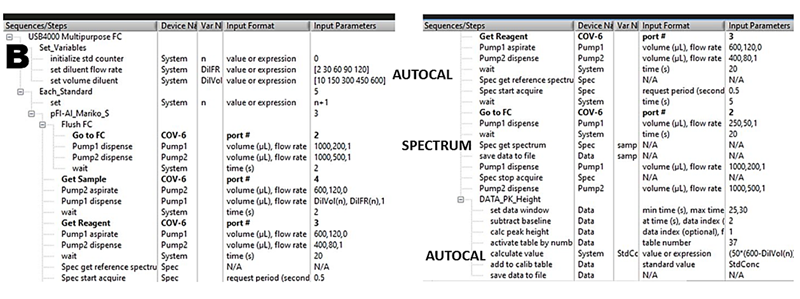
The corresponding software protocol (B) comprises control of microfluidics (A) and data collection and processing (autocalibration, spectrum). The autocalibration generates a calibration graph by autodilution of a single standard solution in five steps, each step performed in triplicate, thus yielding a fifteen-point calibration graph. Detailed explanation of this Single Standard Calibration (SSC) technique are described in Section 3.2.5.
 The CCD spectrometer is controlled by two panels (C and D). It is initialized in three steps, while the flow cell is filled with carrier – deionized water (DI).

1/ With light source OFF, set values shown in panel C.
2/ Get Dark Spectrum as shown on panel D2.
3/ With light source ON, tune light intensity to 18.000 cps as shown on panel D3.
4/ Get Reference Spectrum. This will set baseline as shown in panel D4. Zeroed Reference Spectrum will be stored in memory, and it will be refreshed EVERY time when “reference spectrum” is called by software assay protocol.
Therefore, there will be no peak at 450 nm ONLY if flow cell is filled with DI when spectrum is recorded. If FC is filled with lumogallion + buffer, NEGATIVE peak @450 nm indicates that less excitation light is reflected into CCD.
Set up and prime instrument as follows: carrier (P1 and P2) is the DI water. The reagent is 25 μM lumogallion in 0.05 M acetate buffer pH 5.5. The calibration standard is 40 nM Al in 0.005 M HCL (should be prepared daily by dilution with DI of more concentrated Al standard stored in 0.1 M HCl). For further information, see ref. Sutheimer and Cabanis above.
.png.aspx)
The autocalibration program (B) will yield fluorescence (cps) / time response curves (E) and corresponding calibration (F) obtained by plotting the maximum cps value captured within WIN interval positioned during stop flow period.

The spectra (G) were recorded during autocalibration run (E), obtained by using 40 nM Al standard (in 0.01M HCl), auto diluted by DI water carrier down to calibration BLANK obtained when flow cell was filled with reagent and DI.
The EDTA spectrum was obtained by analyzing 0.005 M EDTA, while the reagent was 24 μM lumogallion in 0.05 M ammonium acetate pH 5.5. Since HH EDTA forms a stronger complex with Al than lumogallion, fluorescence intensity is reduced to yield the value of REAGENT BLANK.
Next, to obtain value of INSTRUMENT BASELINE, reagent was replaced by DI and DI was also injected as sample. Therefore the DI spectrum and cps value (Fig. H) were obtained when flow cell was filled with DI water.
Data collected from amplified spectra of EDTA and DI water (H) yield REAGENT BLANK of 8 cps (56-48) above INSTRUMENT BASELINE. This along with 84% RSD and slope of 52 cps results in INSTRUMENT LOD = 0.52 nM Al.
In summary, the high value of calibration BLANK (665/52 = 13 nM Al, Fig. F), due to reagent contamination by Al, elevates the LOD to 2.6 nM Al. However, in absence of Al the instrument blank is 10x lower than LOD reported by Sutheimer and Cabanis who used PMT detector. Finally DI water baseline count of – 55 cps (Fig. H) is equal to DI baseline of – 68 cps found for fluoresceine calibration (Fig. B. 7.2.7.4). Therefore, use of CCD based instrument is feasible.
Sutheimer, S. H.; Cabaniss, S. E. Determination of trace aluminum in natural waters by flow-injection analysis with fluorescent detection of the lumogallion complex. Analytica Chimica Acta 1995, 303 (2), 211-221.