3.2.7.3. Spectrophotometry based silicate assay
J. Ruzicka, M. Davis, M. Hatta and Ch. I. Measures © February 2024
There are three goals in this section. To show that CCD spectrometer designed for fluorescence assay can be used for absorbance monitoring without slit or any other change in physical configuration - a feat deemed impossible by Ocean Insight technical support. Next, that performance of Long Light Path flow cell (A), (Section 2.3.6.) is not compromised when integrated with orthogonal fluorescence flow cell. Third, how flow programming accommodates two reagents assay protocol in the same flow path configuration as used in single reagent protocol, discussed the in previous section.
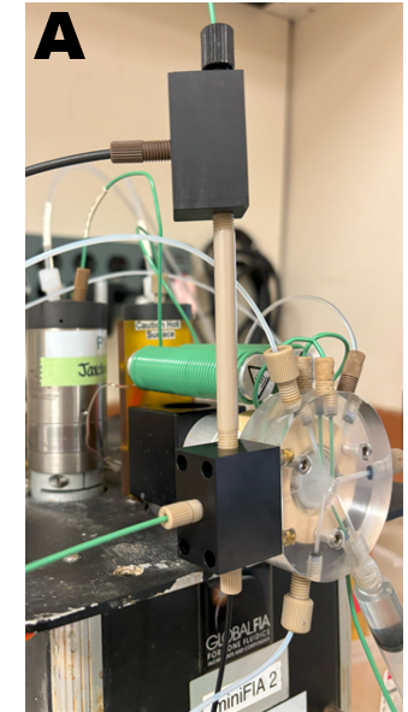
Determination of silica is based on formation of Si molybdenum complex (SiMo) at around pH 2, followed by reduction with ascorbic acid that yields Si molybdenum blue (Si MoB) monitored by spectrophotometry at 810 nm. To avoid reduction of molybdate to molybdenum blue (Mo) which also absorbs at 810nm oxalic acid is used to bind unreacted molybdate.
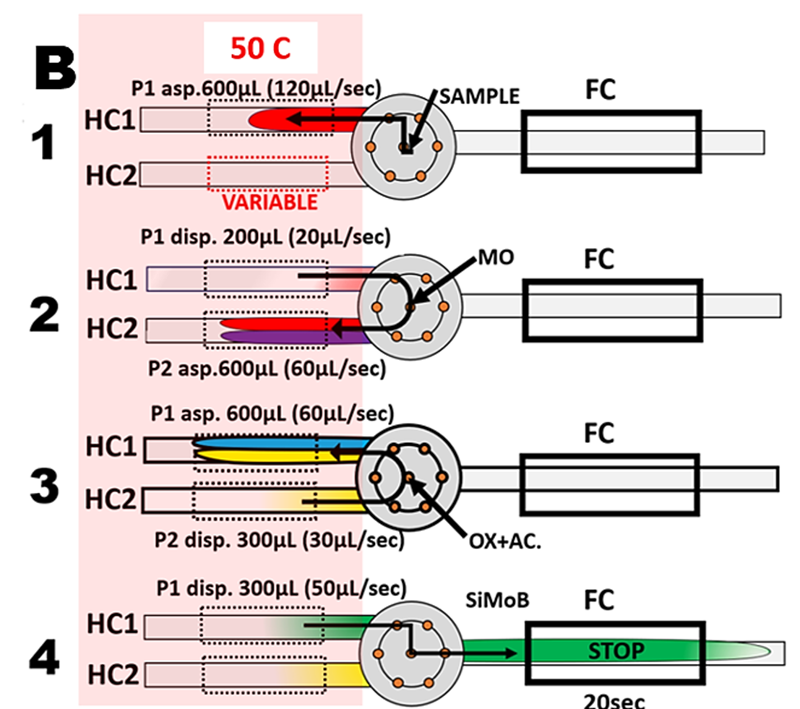
(Section 3.2.5.6.) Therefore the assay protocol (B) comprises four steps. 1/ sample dilution, 2/ addition of molybdenum reagent, 3/ addition of ascorbic/oxalate reagent, 4/ transport into flow cell for 20 seconds stop flow period. Holding coils are thermostated at 50 °C.
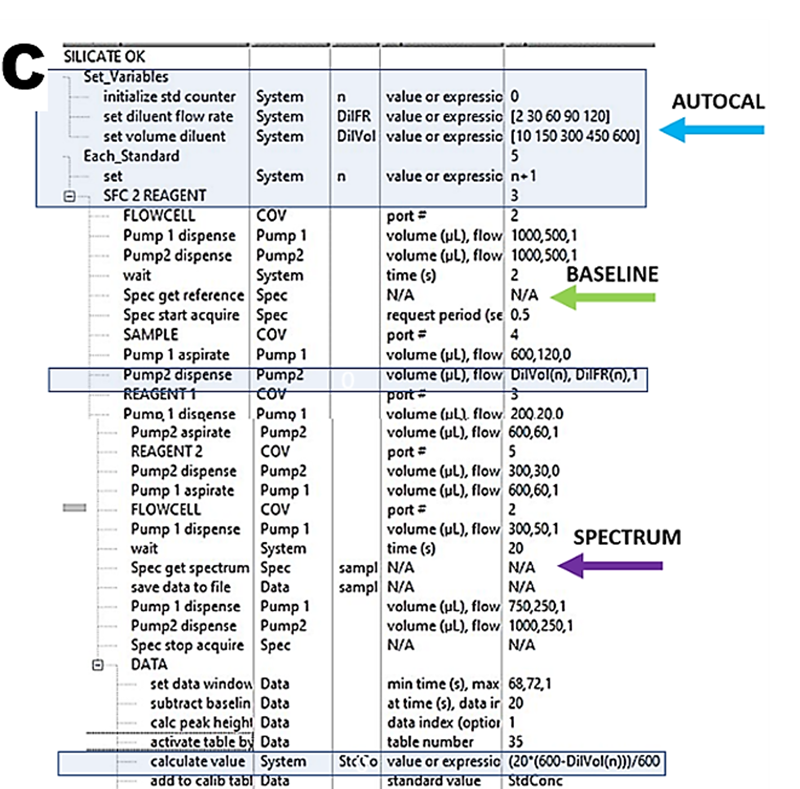
The corresponding software protocol (C) comprises control of microfluidics (B), data collection, and processing (autocalibration, spectrum). Autocalibration generates a calibration graph by autodilution of a single standard solution in five steps, each step performed in triplicate, thus yielding a fifteen point calibration graph. Detailed explanation of this Single Standard Calibration (SSC) technique is in (Section 3.2.5.)
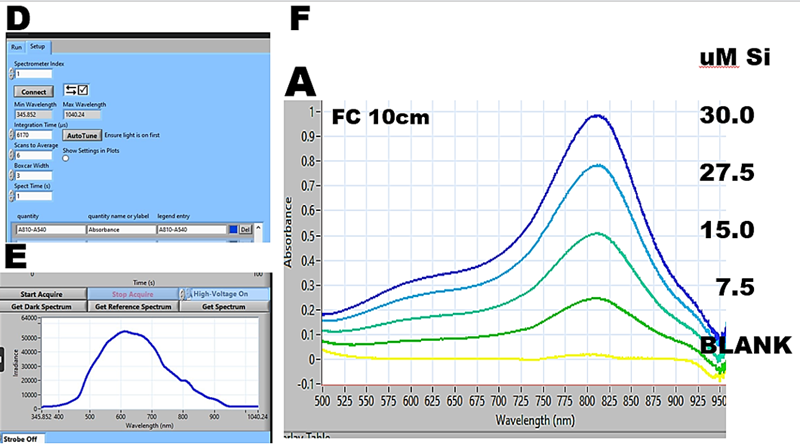
The CCD spectrometer is set to absorbance monitoring by typing in monitoring (A 810) and reference (A540) wavelengths into panel (D). Next set integration time to 3000 μ seconds. With both light sources switched OFF on panel (E) press dark current and with tungsten light ON press reference spectrum. Tune intensity of tungsten lamp until irradiance spectrum is similar to one shown on panel (E). Next, by pressing autotune the integration time will be finely adjusted, and spectrum will be as shown. Note: if the intensity of tungsten light source is too high try a gray filter or decrease aperture.
Set up and prime instrument as follows: carrier (P1 and P2) is DI water. Molybdate reagent: 0.81 mM molybdate in 0.1 M sulfuric acid. Ascorbic acid/oxalate: 2g of sodium oxalate + 2g ascorbic acid + 2g dodecyl sulfate were dissolved in 100mL DI water. Silicate standard was 30 uM Si in 0.01 M HCl.
The calibration run will yield a spectrum of each dilution step (F) as well as series of absorbance/time response curves (G). By plotting maximum absorbance value, captured during the stop flow period within the data collection window, (WIN) versus Si concentration the calibration graph (H) is generated.
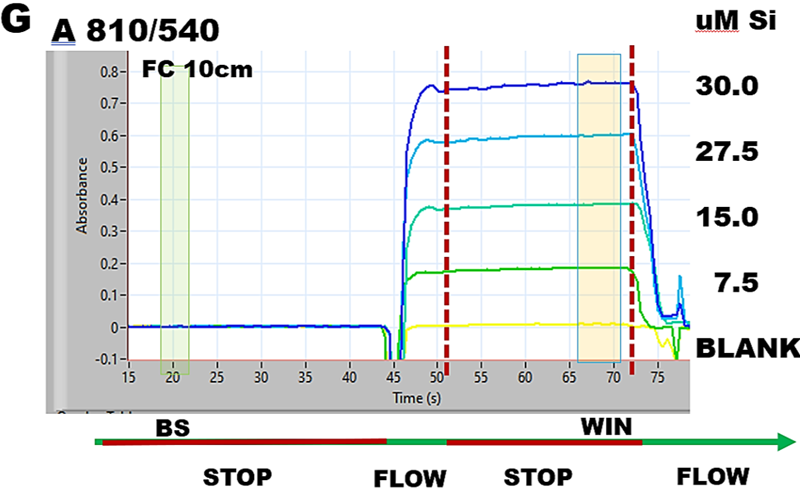
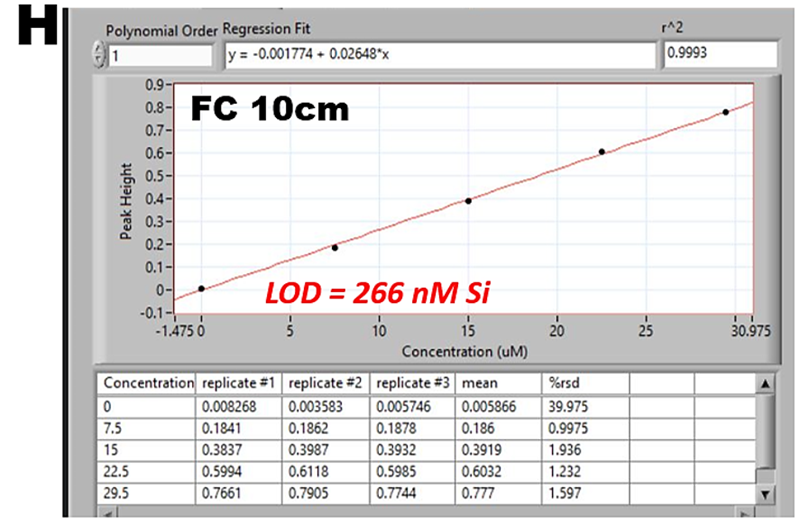
To identify the components comprising limit of detection (LOD = 266 nM Si), a section of a blank calibration run (I) was amplified to allow estimate amplitudes of DI water response (recorded within BS window Fig. G) and of reagent + DI water BLANK, while using slope and r.s.d from Fig. H.
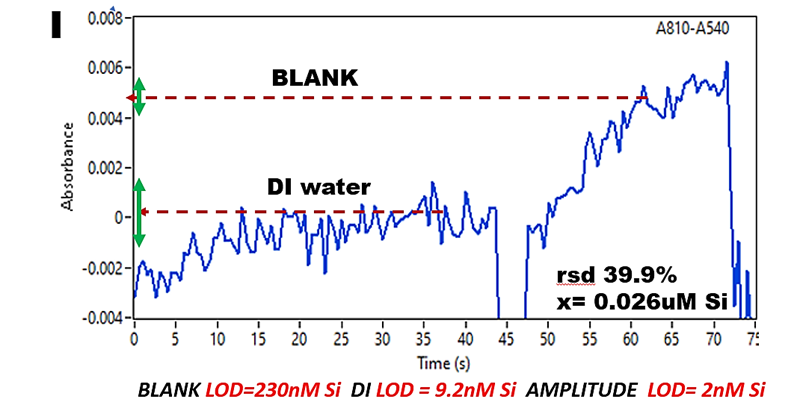
The reagent blank of this, single run (LOD=230 nM Si), compared with DI water (LOD= 9.2 nM Si), indicates that reagents ( Mo+AA+Ox) elevated LOD value way above of DI value. Interestingly, the combined noise (amplitude) of light source and CCD, recorded when flow cell was filled with DI, corresponds to LOD=2nM Si. This finding is in agreement with LOD obtained with spectrophotometric determination of nitrite when instrument noise corresponded to LOD= 6nM N. (Section 3.2.5.3.).